

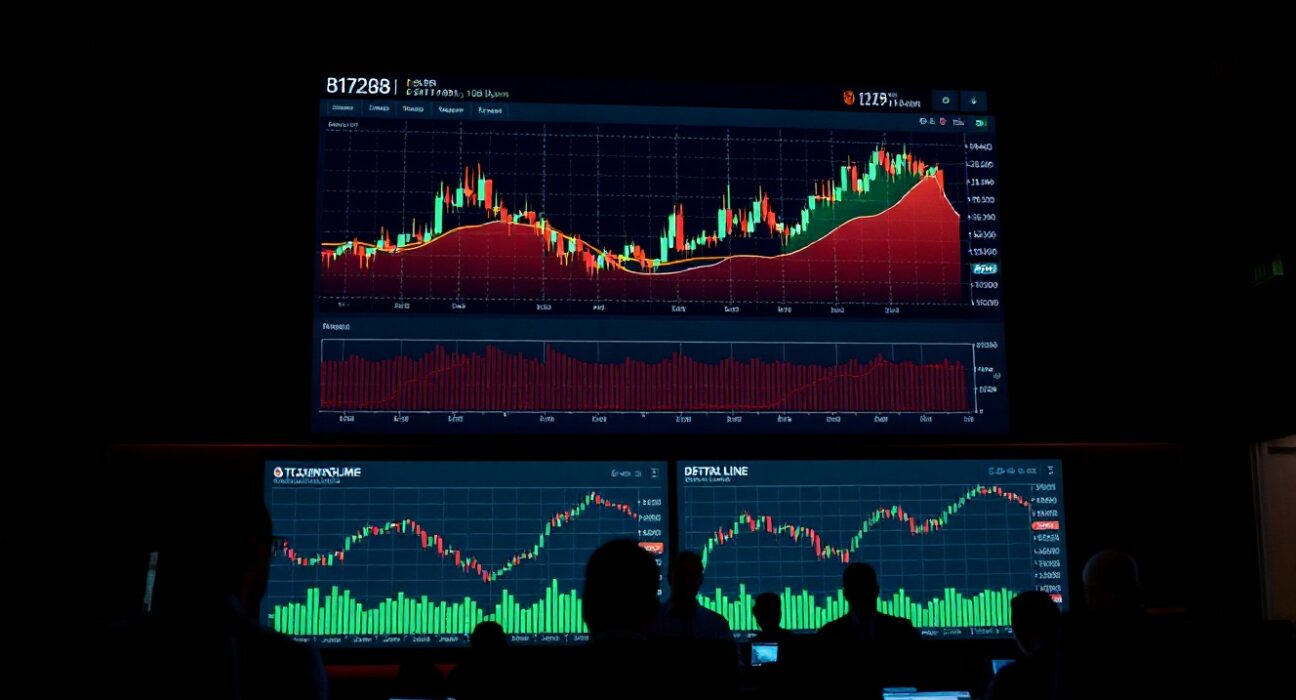
On Aug. 18 at 9:00 a.m., the Bitcoin spot market displayed notable order flow activity, as captured by the cumulative volume delta (CVD) chart for the BTC/USDT trading pair. The chart, which tracks the balance between aggressive buying and selling, offers traders a granular view of market pressure at specific price levels.
Understanding the Spot CVD Chart
The spot CVD chart is a tool used by traders to analyze order book dynamics. It consists of two primary components: the volume heatmap in the upper panel and the cumulative volume delta in the lower panel.
The volume heatmap visualizes trading volume at each price level, with brighter colors indicating areas where the price lingered or moved sharply. These zones often act as support or resistance levels, as they represent clusters of historical activity where traders have previously shown interest.
The lower panel’s CVD indicator reflects the net volume of buy and sell orders, segmented by order size. The yellow line tracks orders between $100 and $1,000, while the brown line represents large orders between $1 million and $10 million. When these lines rise, it indicates increasing buying pressure; when they fall, selling pressure dominates.
What the Aug. 18 Data Shows
At the 9:00 a.m. snapshot, the CVD lines for both retail-sized and large orders were moving in tandem, suggesting a broad alignment in market sentiment. The volume heatmap indicated a concentration of activity around the $29,500–$29,800 range, which could serve as a pivot area for the session.
Large-order flow, often associated with institutional activity, showed a slight uptick, hinting at possible accumulation. However, the overall CVD remained below its recent highs, indicating that sellers have not been fully overwhelmed.
Implications for Traders
For traders, the CVD chart provides a real-time read on whether buyers or sellers are in control. The current data suggests a cautious market, with no clear directional bias. The identified support/resistance zones from the heatmap can be used to set stop-loss or take-profit levels.
It’s important to note that CVD is a lagging indicator, and sudden news events can quickly alter the order flow. Traders should combine this analysis with other technical tools and fundamental news for a comprehensive view.
Conclusion
The Bitcoin spot CVD chart for Aug. 18 at 9:00 a.m. reflects a market in equilibrium, with neither buyers nor sellers dominating. The volume heatmap highlights key price levels to watch, while the CVD lines offer insight into the behavior of different order sizes. As always, order flow analysis is one piece of the puzzle, and prudent risk management remains essential.
FAQs
Q1: What is the spot CVD chart used for?
The spot CVD chart is used to analyze the net buying and selling pressure in the spot market by tracking cumulative volume delta. It helps traders identify potential support and resistance levels and gauge market sentiment.
Q2: How does the volume heatmap work?
The volume heatmap displays trading volume at different price levels, with brighter colors indicating higher activity. These areas often act as support or resistance because they represent price levels where significant trading has occurred.
Q3: What do the yellow and brown lines represent in the CVD indicator?
The yellow line tracks orders between $100 and $1,000, representing retail-sized trades. The brown line tracks large orders between $1 million and $10 million, which are often associated with institutional activity. Rising lines indicate buying pressure, while falling lines indicate selling pressure.
Disclaimer: The information provided is not trading advice, Bitcoinworld.co.in holds no liability for any investments made based on the information provided on this page. We strongly recommend independent research and/or consultation with a qualified professional before making any investment decisions.
