

Is Bitcoin gearing up for a breakout or bracing for a breakdown? The leading cryptocurrency is currently in a tug-of-war, consolidating just above the crucial $26,000 support level. But with resistance looming and technical indicators offering mixed signals, what’s the next move for BTC? Let’s dive into the technical analysis to uncover potential scenarios.
Bitcoin’s Current Stand: Holding Above $26,000
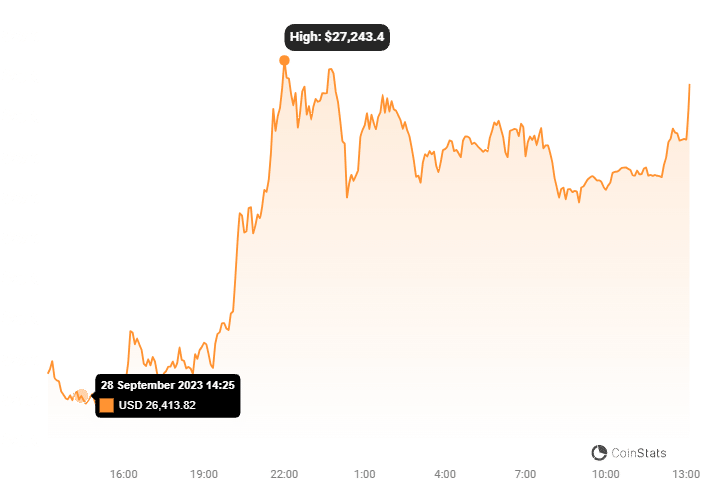
Bitcoin is showing resilience, establishing short-term support above the $26,000 mark. This suggests a potential for an upward move, if this support holds strong. Think of it as building a base camp before attempting to scale a mountain. However, the bears are still in the vicinity, preventing any significant upward momentum.
Key Resistance Levels: The Hurdles Ahead
- Immediate Resistance: $26,300. This level aligns with a major bearish trend line on the hourly chart. Overcoming this will be the first challenge.
- Next Hurdle: $26,500. A successful breach here could signal a stronger bullish move.
- Target: $27,000. Clear these resistance levels, and Bitcoin could be eyeing a move towards $27,000.
Downward Scenario: What if Support Breaks?
If Bitcoin fails to overcome the $26,300 resistance, a downward move becomes increasingly likely. Here’s what to watch for:
- Immediate Support: $26,050. A minor safety net.
- Critical Support: $26,000. This is the line in the sand. A break below this level could trigger accelerated losses.
- Potential Targets Below: $25,400, followed by a possible move towards the psychological $25,000 level.
Technical Indicators: What Are They Saying?
Technical indicators provide additional clues about the market’s momentum. Here’s a quick rundown:
- MACD (Moving Average Convergence Divergence): Suggests that bearish momentum may be waning. This could hint at a potential shift in sentiment.
- RSI (Relative Strength Index): Hovers around the 50 level. This indicates balanced momentum, with neither a strong bullish nor bearish bias. It’s essentially a neutral signal.
Actionable Insights: Trading Bitcoin Right Now
Given the current technical picture, here are a few actionable insights for traders and investors:
- For Bullish Traders: Watch for a break above $26,300. A confirmed breakout could present a buying opportunity, targeting $26,500 and potentially $27,000.
- For Bearish Traders: A break below $26,000 could signal a shorting opportunity, with targets at $25,400 and $25,000.
- For Long-Term Investors: Consider the broader market context. Are there any fundamental factors that could influence Bitcoin’s price in the long run? Don’t rely solely on short-term technical analysis.
Conclusion: Navigating Bitcoin’s Next Move
Bitcoin’s resilience above $26,000 is notable, but the path forward remains uncertain. The cryptocurrency’s near-term trajectory hinges on its ability to decisively break above the $26,300-$26,500 resistance range or decline below the critical $26,000 support level. Keep a close eye on these pivotal levels and the technical indicators discussed to gain better insight into Bitcoin’s next move. Whether you’re a seasoned trader or a long-term investor, understanding these technical dynamics can help you make more informed decisions in the ever-evolving world of cryptocurrency.
Disclaimer: The information provided is not trading advice, Bitcoinworld.co.in holds no liability for any investments made based on the information provided on this page. We strongly recommend independent research and/or consultation with a qualified professional before making any investment decisions.
