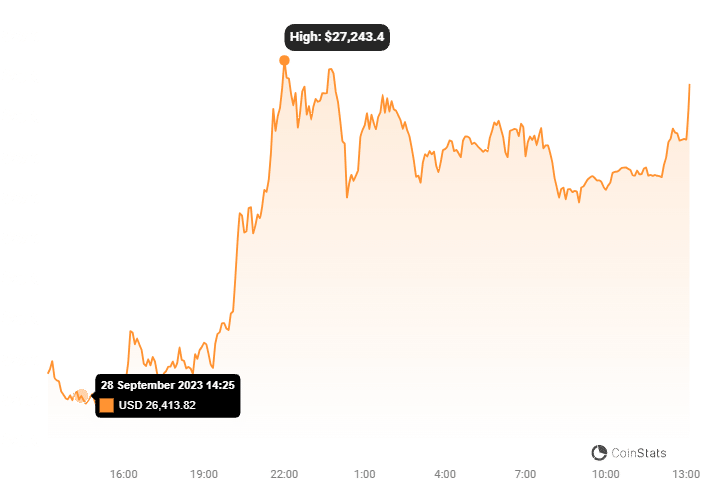
Bitcoin (BTC) continues to navigate the choppy waters of the crypto market, but recent signals suggest a potential for upward movement. Let’s dive into the latest price analysis to understand what’s driving Bitcoin and what key levels traders should be watching.
Bitcoin稳步前行:能否突破关键阻力位?
Currently, Bitcoin is demonstrating resilience above the $26,200 mark. This level is acting as a crucial psychological support for investors, indicating a base where buyers are stepping in. Adding to the bullish sentiment, Bitcoin is trading comfortably above $26,500 and crucially, above the 100-hour Simple Moving Average (SMA). Think of the 100-hour SMA as a short-term trend indicator – staying above it often suggests positive momentum in the immediate future.
Here’s a quick breakdown of the positive indicators:
- Strong Support: $26,200 level holding firm.
- Trading Above SMA: Bitcoin above the 100-hour SMA.
- Bullish Trend Line: A connecting bullish trend line on the hourly BTC/USD chart is providing immediate support around $26,500.
This trend line is like a safety net, suggesting that Bitcoin has a good chance of maintaining its current upward path. If Bitcoin can successfully establish itself above $26,850 and push towards $27,000, we could see a more sustained climb.

近期比特币价格波动:一次小幅回调
Bitcoin’s journey isn’t always a straight line upwards, and we did see a minor dip recently. The price briefly slipped below $26,550, touching a low of $26,412 before buyers stepped back in and pushed the price higher. Interestingly, this dip and subsequent recovery help us identify key Fibonacci retracement levels. Bitcoin has already moved past the 50% Fibonacci retracement level, calculated from the recent low of $26,412 to a swing high of $26,887. This is often seen as a positive sign, suggesting the bulls are regaining control after a temporary pullback.
阻力位:比特币的下一个障碍在哪里?
Now, let’s talk about the hurdles Bitcoin needs to overcome. Resistance levels are price points where selling pressure tends to increase, potentially halting or reversing an upward trend. For Bitcoin, the immediate resistance is near $26,700. Why is this significant? Because it coincides with the 61.8% Fibonacci retracement level – a level often watched by traders for potential reversals.
Beyond $26,700, the next significant resistance zones are:
- $26,850: A key level to break for further gains.
- $27,000: A major psychological barrier.
A decisive move and close above these resistance points could be the catalyst for a stronger bullish surge, potentially opening the door towards $27,200 and even a rally towards the $28,500 mark. For Bitcoin bulls, conquering these resistance levels is the key to unlocking further upside potential.
如果未能突破阻力位:下行风险
Of course, in the world of crypto, things can change quickly. If Bitcoin fails to break above $26,850, we could see a shift in momentum. In this scenario, where should we expect support to kick in? The first line of defense is at $26,500, which conveniently aligns with the bullish trend line we discussed earlier. This level needs to hold to prevent further declines.
However, if $26,500 fails to act as support, the next crucial level to watch is $26,200. A sustained break below this threshold could trigger a more bearish sentiment, potentially pushing Bitcoin down towards $25,650. Falling below $26,200 could signal a shift from a short-term bullish outlook to a more cautious, or even bearish, perspective.
技术指标:牛市信号增强?
To get a deeper understanding of the current market sentiment, let’s look at some key technical indicators. Both the Hourly MACD (Moving Average Convergence Divergence) and the RSI (Relative Strength Index) are currently favoring the bulls.
- Hourly MACD: Showing increasing momentum in the bullish zone. This suggests that buying pressure is building.
- Hourly RSI: Has climbed above 50, indicating strengthening bullish momentum and suggesting that buyers are becoming more aggressive.
These indicators reinforce the optimistic view for Bitcoin’s short-term price action, suggesting that the technicals are currently aligned for a potential upward move.
总结:比特币的下一步走向?
In conclusion, Bitcoin finds itself at a critical juncture. It’s delicately balanced between potential bullish breakouts and bearish retracements. The coming days will be pivotal in determining its next direction. Keep a close eye on these key levels:
- Key Resistance Levels: $26,850 and $27,000. Breaching these could signal a strong bullish move.
- Key Support Levels: $26,500 and $26,200. Holding these is crucial to prevent a bearish downturn.
The battle between bulls and bears is ongoing, and these levels will likely dictate the short-term trajectory of Bitcoin. Stay tuned for further updates as the market unfolds!
Disclaimer: The information provided is not trading advice, Bitcoinworld.co.in holds no liability for any investments made based on the information provided on this page. We strongly recommend independent research and/or consultation with a qualified professional before making any investment decisions.


