
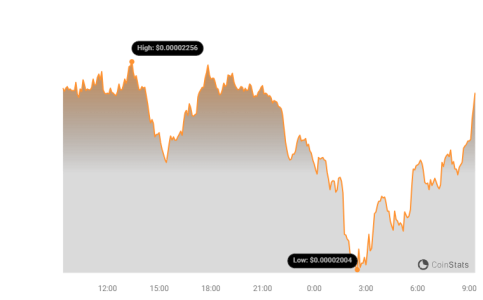
After bleeding for most of the week, the price of BONK posted gains of 15% as the weekend began. At press time, BONK was valued at $0.000022 on the charts — A noteworthy uptick from when it dropped to $0.000018 on 5 July.
That’s not all though, and the meme coin’s price might continue to hike similarly, according to Bitcoinworld’s analysis. One reason for this prediction is the token’s social dominance.
According to Santiment, BONK’s social dominance increased to 0.303%. Social dominance measures the share of discussions an asset has within all crypto conversations on social media platforms.
When it rises, it means discussions online have improved. That was the situation with BONK. However, a fall suggests something else completely.
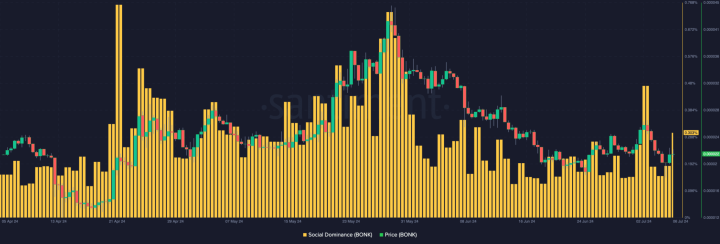
Historically, social dominance has had a correlation with an asset’s price. For example, on-chain data revealed that whenever BONK discussions online move from low to high, the price follows suit.
As can be seen in the chart below, this has happened quite a few times, including on 20 April, 20 May, and 24 June. If the previous pattern rhymes, then the value of the token could be in place to hit $0.000024 in the short term.
Despite the correlation between the metrics though, it is important to mention that if discussions get too intense, it would spell a local top for the price.
Proof of this can be seen in the chart as extremely high social dominance foreshadows a price decline. Therefore, if BONK’s price continues to increase, and social dominance gets overheated, it could face another downtrend.
BONK to $0.000024 Programmed?
We also observed that the one-day volatility around the meme coin jumped. The hike in volatility can be interpreted as a testament to the quick pace with which the price hike took over the market.

If buying pressure for BONK rises and if it is accompanied by high volatility, the jump to $0.000024 might be validated. On the contrary, if volatility continues to fall, the token might trade sideways on the charts.
Hence, it is necessary to evaluate the potential price targets from a technical perspective.
According to the 4-hour chart, for instance, the Awesome Oscillator (AO) was negative. Here, the AO is a sign of momentum.
When it is positive, it means that the momentum is bullish. However, a negative reading implies bearish momentum. For BONK, though the AO was negative, it flashed green histogram bars.
This indicated that bulls were attempting to validate the upswing.
Finally, the uptick in the On Balance Volume (OBV) indicated that buying pressure rose too. If sustained, the altcoin’s price might climb above $0.000024 on the charts.
Should this be the case, the Solana-based meme coin might hit $0.000026. However, if bears reject this move, the price might drop to $0.000019 again.
Disclaimer: The information provided is not trading advice, Bitcoinworld.co.in holds no liability for any investments made based on the information provided on this page. We strongly recommend independent research and/or consultation with a qualified professional before making any investment decisions.