
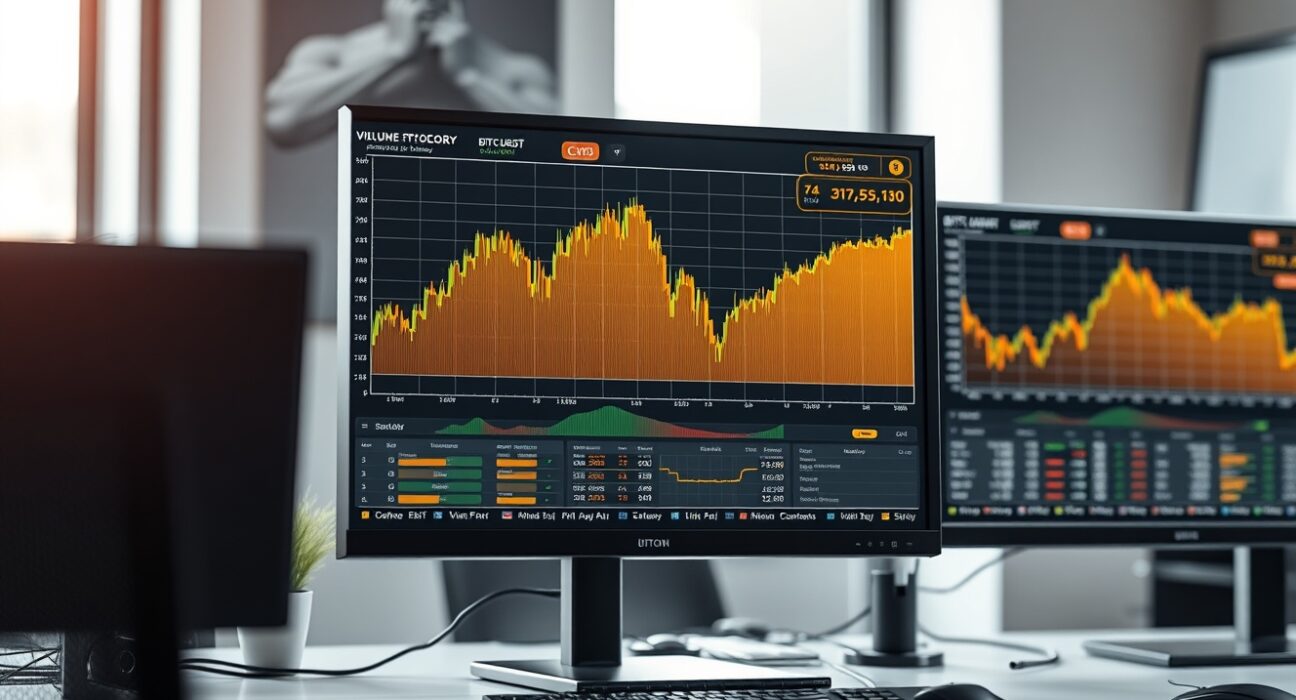
On May 30, traders analyzing the BTC/USDT spot pair are closely watching the Cumulative Volume Delta (CVD) chart, which provides a granular view of order book dynamics. The chart combines a volume heatmap at the top with a CVD indicator below, offering insights into potential support and resistance levels based on trade activity at specific price points.
Understanding the Volume Heatmap
The top section of the chart displays a volume heatmap that tracks the intensity of trades at various price levels. Brighter zones on the heatmap indicate areas where the price has either consolidated for an extended period or experienced significant movement. These zones are often interpreted by traders as potential support or resistance levels, as they represent clusters of historical order flow where large numbers of buyers or sellers have previously stepped in.
For the BTC/USDT pair, the heatmap on May 30 shows heightened activity near key psychological levels, suggesting that these areas may act as price magnets or barriers in the short term.
Cumulative Volume Delta (CVD) Breakdown
The CVD indicator at the bottom of the chart categorizes buy and sell orders by size, providing a clearer picture of institutional versus retail activity. As buy orders increase, the corresponding colored line rises. The yellow line tracks orders between $100 and $1,000, typically associated with retail traders. The brown line represents large orders ranging from $1 million to $10 million, which are often linked to institutional or whale activity.
On May 30, the CVD data reveals that large buy orders (brown line) have been steadily accumulating, while smaller retail orders (yellow line) show more volatility. This divergence may indicate that larger market participants are positioning for a potential move, while retail sentiment remains mixed.
What This Means for Traders
The combination of the volume heatmap and CVD offers a multi-layered view of market structure. Traders can use the heatmap to identify high-probability support and resistance zones, while the CVD helps gauge the strength of buying or selling pressure at those levels. For instance, if the price approaches a bright zone on the heatmap and the CVD shows rising large buy orders, that level may act as strong support. Conversely, if the CVD shows declining buy orders near a resistance zone, the price may struggle to break higher.
This type of analysis is particularly useful for short-term traders looking to time entries and exits based on order flow, rather than relying solely on lagging indicators.
Conclusion
The BTC/USDT spot CVD chart for May 30 highlights a market where institutional accumulation appears to be ongoing, while retail activity remains more erratic. Traders should monitor the volume heatmap for key price levels and the CVD for shifts in order flow dynamics. As always, no single indicator guarantees future price movements, and combining CVD analysis with other tools can provide a more complete trading picture.
FAQs
Q1: What is Cumulative Volume Delta (CVD)?
CVD is an order book indicator that tracks the net difference between buy and sell orders, categorized by size. It helps traders understand whether buying or selling pressure is dominant at a given price level.
Q2: How is the volume heatmap different from CVD?
The volume heatmap shows the intensity of trade activity at specific price levels over time, highlighting potential support and resistance zones. CVD focuses on the cumulative delta of buy and sell orders, providing insight into order flow direction and strength.
Q3: Can CVD be used for long-term investing?
CVD is primarily a short-term trading tool, as it reflects real-time order book dynamics. Long-term investors may find it useful for identifying entry points during periods of significant order flow imbalance, but it is not designed for multi-month trend analysis.
Disclaimer: The information provided is not trading advice, Bitcoinworld.co.in holds no liability for any investments made based on the information provided on this page. We strongly recommend independent research and/or consultation with a qualified professional before making any investment decisions.