Ever wondered what the charts are saying about Bitcoin and Ethereum? Let’s dive into the recent price action and explore potential scenarios for these leading cryptocurrencies. We’ll break down the key levels and what they mean for traders like you.
Bitcoin’s Battleground: What’s Next for BTC?
Looking at Bitcoin’s higher time frames (HTF), we can see some interesting developments:
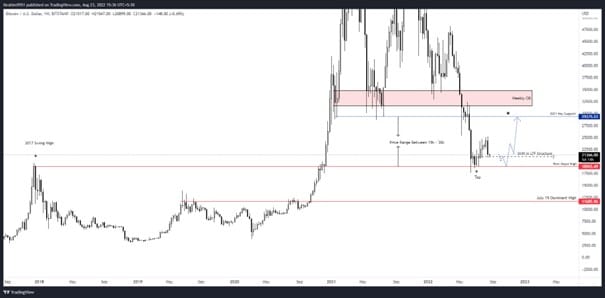
- Weekly Perspective: Bitcoin found support around the $18,965 mark, which interestingly coincides with the 2018 all-time high. We saw a positive push, with the weekly candle aiming for the $25,000 region – a potential 25% surge, leading to a welcome relief rally for about a month.
- The Crucial Question: The recent price dip and how Bitcoin holds its current structure are vital indicators for the coming month. Will it maintain its footing, or will we see further downward pressure?
The Price Void: $18,965 – $29,375
From a technical standpoint, the area between $18,965 and $29,375 is considered an ‘inefficient’ price void, suggesting a high probability it will eventually be filled. Keep an eye on this range!
Maintaining Bullish Momentum: For Bitcoin to stay in a bullish market structure, holding above $20,800 is critical. This level acts as a significant support.
Zooming In: Bitcoin’s Daily Chart Dynamics
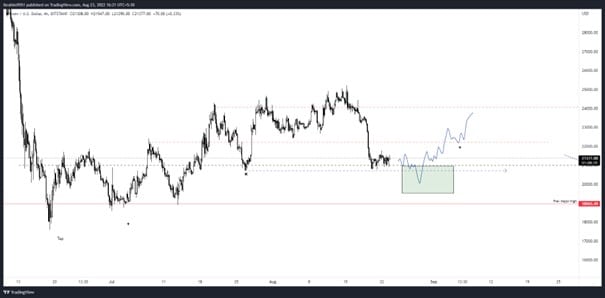
The daily chart echoes the weekly analysis, but with a closer focus. To maintain any short-term bullish sentiment, Bitcoin needs to show strength at its current price level.
Key Steps for a Bullish Scenario:
- Secure the Lows: Hold the support around $20,000.
- Reclaim Key Territory: Push back above the $21,000 level.
- Efficient Growth: Consistently claim each crucial upside level.
Ethereum’s Journey: Riding the Merge Wave
Now, let’s shift our attention to Ethereum (ETH).
Following Bitcoin’s Lead: Similar to Bitcoin’s price action, Ethereum mirrored its trends, resulting in an impressive 70% rally from its mid-summer lows. The much-anticipated ETH Merge acted as a significant catalyst, pushing the price to around the $2,000 mark.
Technical Check-up: What Do the Charts Tell Us About ETH?
Let’s break down the technical perspective for Ethereum:
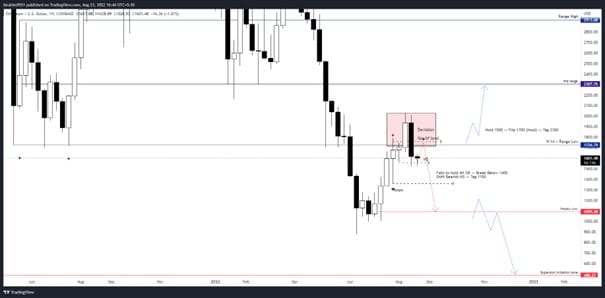
- Revisiting the Lows: Ethereum tagged the lows of June 21st, hovering around the $1,700-$2,900 range.
- Struggles and Rejection: The price struggled to stay within this range and failed to hold the critical $1,700 HTF level.
- Bearish Signals: The formation of a “Bearish Engulfing Candle” and rejection from the range low present a challenge to the previous bullish outlook.
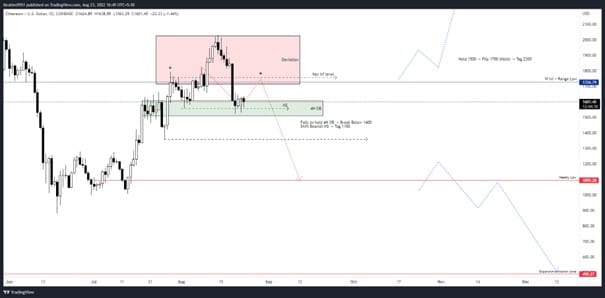
Ethereum’s Daily Dance: Key Levels to Watch
Looking at the daily chart for Ethereum:
The Importance of the 4H Orderblock: As long as the price holds above the 4-hour order block, there’s potential for another push to the upside. Keep a close watch on price formation in this area.
Potential Bearish Shift: However, if Ethereum fails to reclaim the $1,700 level, we could see a shift towards a bearish market structure. A bearish retest could send the price back into the lower end of its recent range, between $1,100 and $1,700.
Key Takeaways and Actionable Insights
So, what does all this mean for you, the crypto trader?
- For Bitcoin: Monitor the $20,800 level closely. Holding above this is a positive sign. The $18,965 – $29,375 range remains a key area of interest for potential future price action.
- For Ethereum: The $1,700 level is crucial. Failure to reclaim this could signal further downside. Keep an eye on the 4H order block for potential support.
- Stay Informed: The crypto market is dynamic. Continuously analyze charts and news to make informed decisions.
- Manage Risk: Always practice sound risk management. Never invest more than you can afford to lose.
In Conclusion: Navigating the Crypto Seas
The crypto market continues to offer both opportunities and challenges. Understanding the technical indicators and key price levels for Bitcoin and Ethereum can provide valuable insights for navigating these digital assets. While past performance is not indicative of future results, staying informed and adaptable is key to succeeding in the exciting world of cryptocurrency trading. Keep watching those charts!
Disclaimer: The information provided is not trading advice, Bitcoinworld.co.in holds no liability for any investments made based on the information provided on this page. We strongly recommend independent research and/or consultation with a qualified professional before making any investment decisions.