The cryptocurrency market continues its thrilling rollercoaster ride, leaving traders and investors on the edge of their seats. Are we seeing crucial support levels tested, or is this just another dip before the next surge? Let’s dive into the latest Bitcoin and Ethereum analysis to decipher the potential future movements.
BTC Analysis: Will $19k Hold?
Weekly Outlook: A Critical Support Test
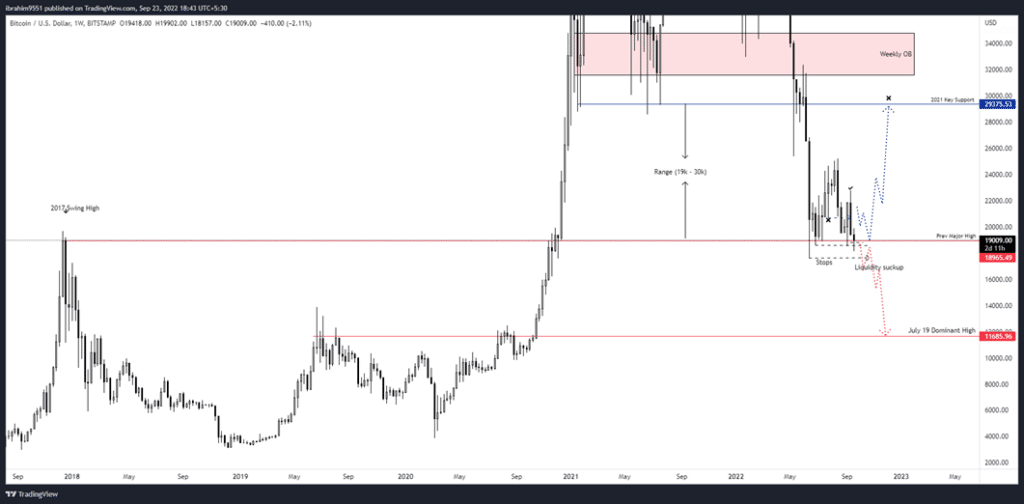
Looking at the weekly timeframe, Bitcoin finds itself once again knocking on the door of the crucial yearly support level around $19,000. This isn’t the first time we’ve seen this dance. The initial tap on this support triggered a respectable 30% upward bounce. However, this rally couldn’t quite reach the $30,000 mark, a level that previously acted as multiple support before breaking down.
As any seasoned trader knows, each subsequent test of a support level can weaken it. This current test is the second, making it even more critical. If Bitcoin fails to hold this line of defense, we could be bracing for a period of increased fear and further downward price action. Think of it like a wall being hit repeatedly – eventually, it might crumble.
Daily Perspective: Awaiting a Clear Direction
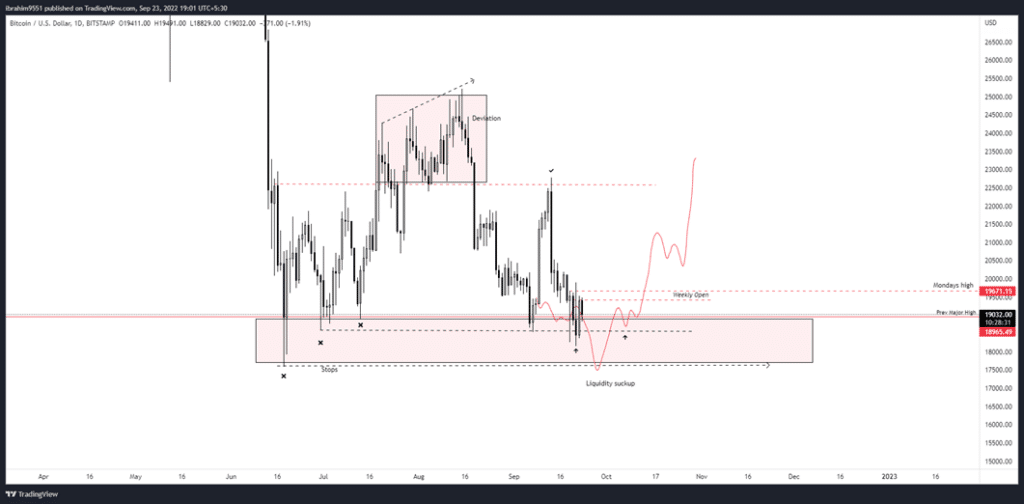
Last week’s analysis didn’t pinpoint a specific directional bias, and for good reason. The Consumer Price Index (CPI) reports triggered a volatile “flash wick dump,” shaking the market. Since then, Bitcoin’s price hasn’t committed to a significant move, instead meandering around the lower end of its current range.
Drawing on insights from the second week of September’s analysis, a potential scenario involved Bitcoin testing the $18,000 lows to absorb liquidity before reversing and reclaiming the weekly open (around $19,800-$20,000). This reclaim could establish a more defined trading range. Until a key price level is decisively broken or held, patience is key. We need to wait for a clearer resolution to emerge.
ETH Analysis: Has the Bottom Been Tested?
Daily Insights: From Anticipation to Action
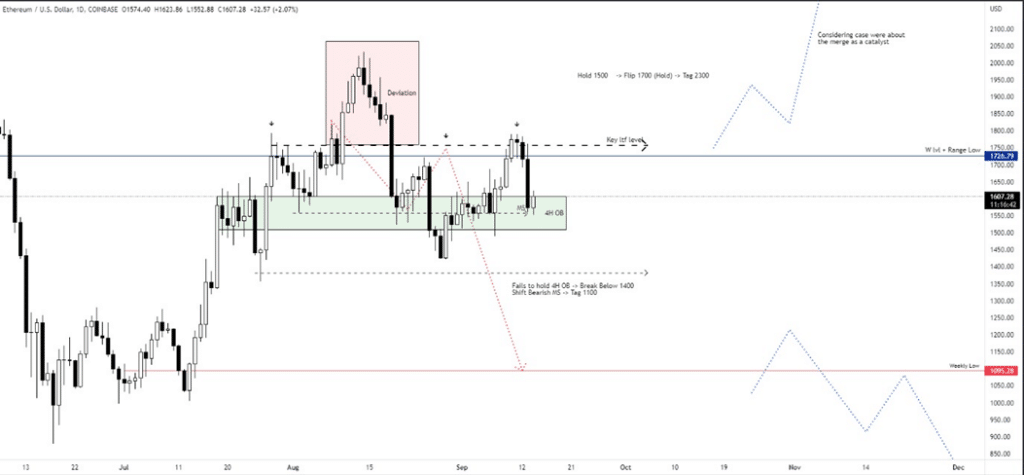
Let’s shift our focus to Ethereum. Looking back at the previous week’s daily chart (Chart 1), the expectation was that if the price failed to hold the 4-hour order block (OB), a slide back towards the $1200 region was likely.
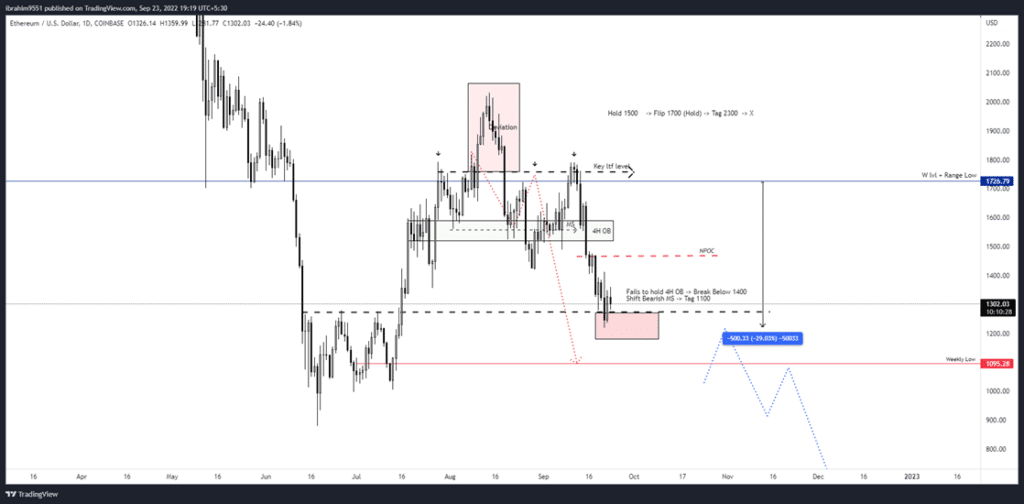
Fast forward to the current week’s daily chart (Chart 2), and we see that the price indeed plunged back into the lower end of the range. As anticipated, it tested the $1300 level, which marks the high of the lowest accumulation price range from July and August. This move resulted in a favorable 30% upward swing.
While the higher timeframe (HTF) outlook remains within an ongoing trend, the lower timeframe (LTF) price action highlights the back-and-forth movement necessary for efficient market moves. The current anticipation is for Ethereum to range and establish a base within the $1100-$1200 price zone. Building this structure could pave the way for an upward shift.
However, if this scenario doesn’t play out, Ethereum’s price action could mirror Bitcoin’s potential breakdown. Therefore, similar to Bitcoin, we need to see key levels tagged to gain more clarity.
ETH 4-Hour Chart: Potential Paths Forward
The 4-hour chart for Ethereum aligns with the probable price projection outlined earlier. A potential bullish scenario involves taking out the lows around $1100, forming a base, reclaiming the $1300 level, and then targeting the $1600-$1700 range.
On the other hand, if bearish sentiment persists (as it currently does), and Bitcoin breaks below $18,000, we can expect a significant downturn across the entire cryptocurrency market. For Ethereum, breaking below $1100 would create a highly precarious situation, potentially leading to a breakdown towards the $500 price level. This highlights the interconnectedness of the crypto market and the influence of Bitcoin’s movements.
Key Takeaways and Actionable Insights for Crypto Traders
- Bitcoin’s $19k Support: Keep a close watch on whether Bitcoin can hold the $19,000 support level. A break below could signal further downside.
- Ethereum’s Ranging Potential: Monitor Ethereum’s activity within the $1100-$1200 zone for signs of a potential base formation.
- Correlation with Bitcoin: Remember the strong correlation between Bitcoin and other cryptocurrencies. Bitcoin’s movements often dictate the overall market trend.
- Patience is Key: Avoid impulsive decisions. Wait for clear price action and confirmation before making significant trades.
- Risk Management: Always employ proper risk management techniques to protect your capital, especially during periods of uncertainty.
The Bottom Line: Navigating Uncertainty in the Crypto Market
The cryptocurrency market remains in a state of flux, with both Bitcoin and Ethereum facing critical junctures. Understanding the key support and resistance levels, analyzing price action across different timeframes, and staying informed about broader market trends are crucial for navigating this environment. While uncertainty persists, diligent analysis and a patient approach can help traders and investors make informed decisions and potentially capitalize on future opportunities. Keep a close eye on these key levels – they could dictate the next major move in the crypto world.
Disclaimer: The information provided is not trading advice, Bitcoinworld.co.in holds no liability for any investments made based on the information provided on this page. We strongly recommend independent research and/or consultation with a qualified professional before making any investment decisions.


