
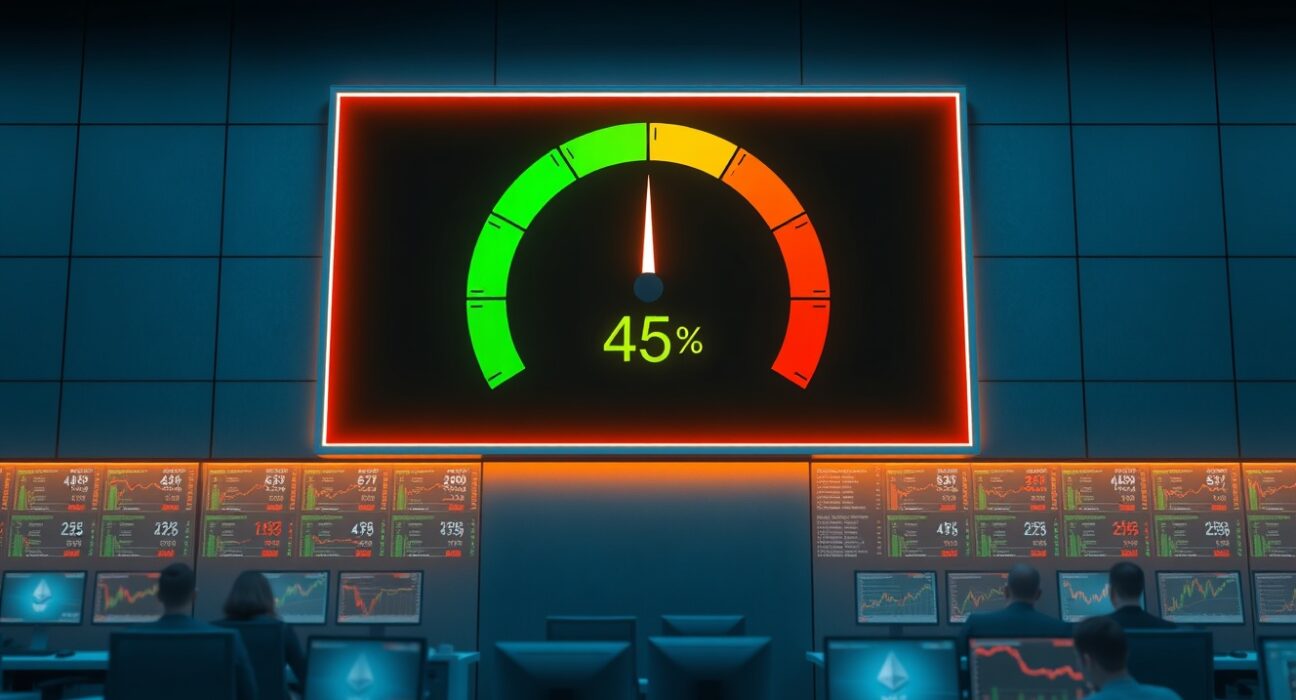
The Crypto Fear and Greed Index has dropped to 45, according to CoinMarketCap’s latest data. This one-point decline from yesterday’s reading places the index firmly in the neutral stage. Market participants now observe a cautious sentiment across digital assets. The index measures investor emotions on a scale from 0, representing extreme fear, to 100, signaling extreme greed. A neutral reading often precedes significant price movements. This shift arrives amid mixed signals from global financial markets.
Understanding the Crypto Fear and Greed Index Drop
The Crypto Fear and Greed Index provides a quantitative snapshot of market psychology. CoinMarketCap calculates this proprietary metric using multiple data points. These include price movements of the top 10 cryptocurrencies by market capitalization. Market volatility also plays a critical role. Additionally, the index incorporates derivatives market data, such as put/call ratios. The Stablecoin Supply Ratio (SSR) and CoinMarketCap’s own search data further refine the calculation. A reading of 45 suggests investors feel neither overly optimistic nor excessively fearful. This neutrality often indicates a period of consolidation or indecision.
Key Components of the Index Calculation
- Price Momentum: The index tracks the moving average of the top 10 crypto assets. A 30-day and 90-day comparison reveals market direction.
- Market Volatility: Sudden price swings increase fear levels. Stable prices tend to push the index toward greed.
- Derivatives Data: Put/call ratios from major exchanges show hedging activity. High put volumes indicate bearish sentiment.
- Stablecoin Supply Ratio (SSR): A low SSR suggests investors are moving capital into stablecoins, a defensive move. A high SSR implies buying pressure.
- Search Volume: Google Trends and CoinMarketCap search data for terms like ‘Bitcoin’ or ‘buy crypto’ correlate with retail sentiment.
Market Context Behind the Decline
Bitcoin, the largest cryptocurrency by market cap, has experienced a 3% decline over the past week. Ethereum followed a similar pattern, dropping 2.5% in the same period. These price movements directly influence the Crypto Fear and Greed Index. The neutral stage at 45 reflects a market digesting recent macroeconomic news. Interest rate decisions from the U.S. Federal Reserve continue to impact risk assets. Additionally, regulatory developments in the European Union and Asia contribute to uncertainty. Investors now weigh potential opportunities against downside risks.
Historical Behavior at the Neutral Stage
Historically, the neutral stage between 40 and 60 has preceded both bullish and bearish breakouts. In January 2023, the index hovered around 48 before a 30% rally in Bitcoin over the following month. Conversely, in March 2024, a neutral reading of 52 preceded a 15% correction. The current reading of 45 leans slightly toward fear, but remains within the neutral band. Market analysts at Glassnode note that neutral zones often coincide with low trading volumes. This suggests a lack of conviction among large investors.
Impact on Retail and Institutional Investors
Retail traders often interpret the Crypto Fear and Greed Index as a contrarian signal. When the index drops into neutral, some see it as a buying opportunity. Others view it as a warning to reduce exposure. Institutional investors, however, rely on more granular data. They analyze on-chain metrics like exchange inflows and whale activity. The neutral stage does not trigger automatic actions for these players. Instead, they wait for confirmation from other indicators. The index serves as a complementary tool, not a standalone decision-maker.
Expert Perspectives on Current Sentiment
Katie Stockton, founder of Fairlead Strategies, emphasizes that neutral readings require patience. She states, ‘The index at 45 tells us the market is in equilibrium. We need a catalyst to break this balance.’ On-chain analyst Willy Woo adds that the Stablecoin Supply Ratio suggests capital is waiting on the sidelines. ‘The SSR is at 3.2, indicating that stablecoin holders are ready to deploy capital. This could fuel a move higher if sentiment shifts,’ Woo explains. These expert views highlight the importance of context when interpreting the index.
Broader Implications for the Cryptocurrency Market
The Crypto Fear and Greed Index drop to 45 occurs against a backdrop of evolving market structure. Spot Bitcoin ETFs in the United States have seen net outflows of $200 million over the past week. This suggests institutional profit-taking. Meanwhile, decentralized finance (DeFi) protocols report declining total value locked (TVL). The neutral sentiment reflects a market in transition. Investors are moving from a speculative phase to a more valuation-driven approach. This shift aligns with the maturation of the crypto asset class.
Comparison with Traditional Market Sentiment
Traditional financial markets also show neutral sentiment. The CNN Money Fear and Greed Index for equities currently reads 48. This correlation suggests that macroeconomic factors drive sentiment across asset classes. Rising bond yields and a strong U.S. dollar pressure risk assets globally. Cryptocurrencies, often labeled as risk-on assets, feel these effects acutely. The neutral stage in both markets indicates a wait-and-see approach from investors. Any deviation could signal a divergence in crypto-specific factors.
Technical Analysis of the Index Trend
The Crypto Fear and Greed Index has declined from a greed reading of 62 just two weeks ago. This downward trend of 17 points in 14 days represents a significant sentiment shift. Technical analysts look for support levels in the index. The 40 mark often acts as a psychological floor. If the index breaks below 40, it would enter the fear zone. A move below 25 would indicate extreme fear, historically a buying opportunity. The current trajectory suggests further downside risk if negative news emerges.
Data-Driven Insights from CoinMarketCap
CoinMarketCap’s search data reveals a 12% increase in queries for ‘sell crypto’ over the past week. Conversely, searches for ‘buy the dip’ have decreased by 8%. This behavioral data feeds directly into the index calculation. The put/call ratio on major derivatives exchanges has risen to 1.1, indicating more bearish bets. The market volatility component shows a 5% increase in daily price swings for top assets. These metrics collectively support the neutral reading of 45.
What This Means for Traders and Investors
For short-term traders, the Crypto Fear and Greed Index at 45 suggests range-bound conditions. Scalping strategies may perform better than trend-following approaches. Swing traders should watch for a break above 55 or below 35 for directional signals. Long-term investors view the neutral stage as an accumulation zone. Dollar-cost averaging into positions during neutral periods has historically yielded favorable risk-adjusted returns. The key is to avoid emotional reactions to daily fluctuations.
Risk Management Considerations
Risk management becomes paramount in neutral market conditions. Position sizing should reflect the uncertainty. Stop-loss orders at key support levels protect against sudden moves. Diversification across large-cap and mid-cap assets reduces portfolio volatility. The neutral stage is not a time for aggressive leverage. Derivatives traders should reduce position sizes until a clear trend emerges. These practices align with professional trading standards.
Conclusion
The Crypto Fear and Greed Index drop to 45 places the market in a neutral stage. This reading reflects balanced sentiment between fear and greed. Investors should monitor the index for shifts toward extreme levels. The current data suggests caution but not alarm. Historical patterns indicate that neutral zones often precede significant price moves. Market participants must combine this index with other tools for informed decisions. The cryptocurrency market remains dynamic, and sentiment can change rapidly.
FAQs
Q1: What does a Crypto Fear and Greed Index of 45 mean?
A1: A reading of 45 indicates neutral market sentiment. Investors are neither extremely fearful nor overly greedy. This often signals a period of consolidation or indecision.
Q2: How is the Crypto Fear and Greed Index calculated?
A2: CoinMarketCap calculates it using price momentum of the top 10 cryptocurrencies, market volatility, derivatives data like put/call ratios, the Stablecoin Supply Ratio (SSR), and search volume data.
Q3: Is a neutral reading of 45 a buy or sell signal?
A3: A neutral reading is not a definitive signal. It suggests waiting for confirmation. Some traders view it as a potential accumulation zone, while others reduce exposure.
Q4: What factors caused the index to drop to 45?
A4: Recent price declines in Bitcoin and Ethereum, increased market volatility, and a rise in bearish derivatives positions contributed. Macroeconomic factors like Fed rate decisions also play a role.
Q5: How often does the Crypto Fear and Greed Index update?
A5: The index updates daily based on rolling data. CoinMarketCap publishes a new reading each day at 00:00 UTC.
Disclaimer: The information provided is not trading advice, Bitcoinworld.co.in holds no liability for any investments made based on the information provided on this page. We strongly recommend independent research and/or consultation with a qualified professional before making any investment decisions.