
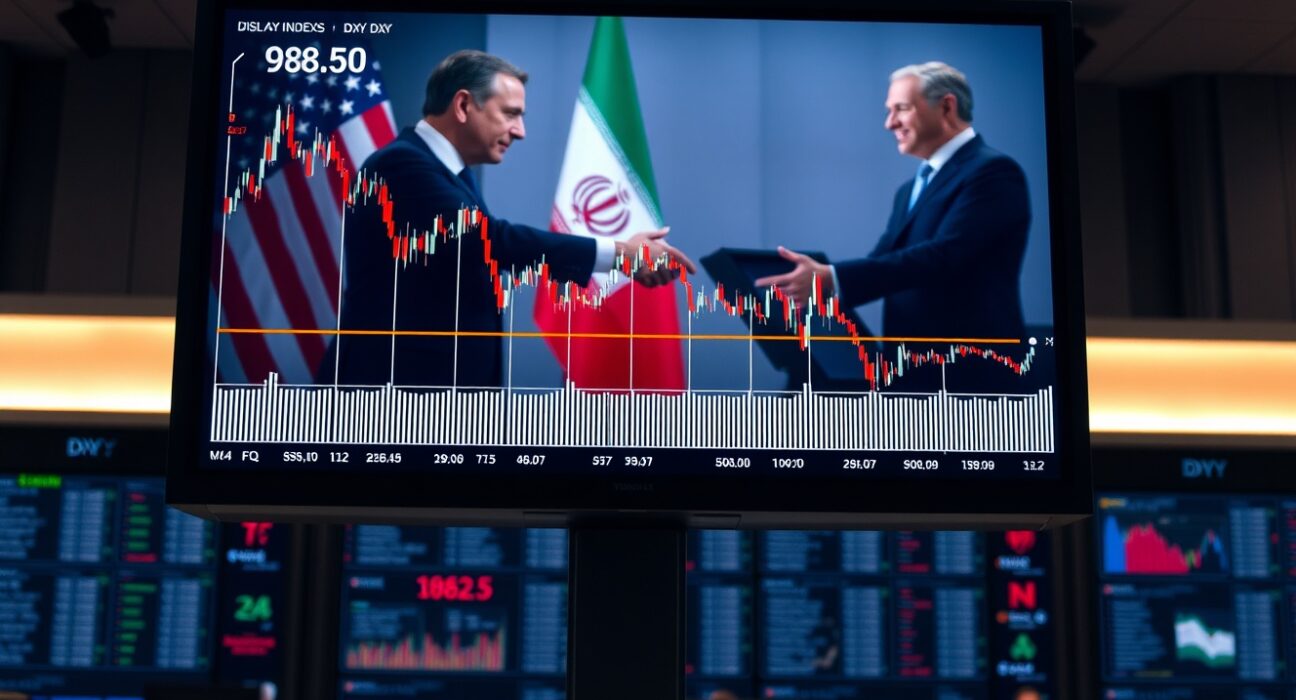
The US Dollar Index price forecast has turned decisively bearish as the greenback struggles to hold ground below the critical 98.50 resistance level and the 38.2% Fibonacci retracement. Renewed hopes for a diplomatic breakthrough between the United States and Iran are driving this shift, prompting traders to reassess safe-haven demand.
Why the DXY Bearish Outlook Strengthens Below 98.50
The 98.50 mark has long served as a key pivot for the US Dollar Index. A sustained break below this level, combined with the 38.2% Fibonacci retracement, signals a loss of bullish momentum. Technical analysts now view this zone as a strong resistance. Consequently, the DXY bearish outlook gains credibility as sellers defend this area aggressively.
Volume data confirms the shift. Trading volumes surged during the recent breakdown, indicating institutional selling pressure. Moreover, the Relative Strength Index (RSI) has dipped below 50, suggesting bearish momentum is building. If the index fails to reclaim 98.50 in the coming sessions, further declines toward 97.00 become likely.
38.2% Fibonacci Level: A Critical Technical Threshold
The 38.2% Fibonacci retracement level, derived from the March 2020 low to the September 2022 high, now acts as a ceiling. This level aligns closely with 98.50, creating a powerful resistance cluster. A close below this zone confirms a trend reversal from bullish to bearish. Traders watch this level closely because it often triggers stop-loss orders and accelerates selling.
Fibonacci levels are widely used in forex markets to identify potential reversal zones. The 38.2% retracement is particularly significant because it represents the first major pullback threshold. When combined with a round number like 98.50, the technical signal becomes even stronger. Therefore, the US Dollar Index price forecast hinges on whether buyers can defend this confluence zone.
US-Iran Peace Hopes Reshape Safe-Haven Demand
The primary catalyst for the DXY’s weakness is the sudden shift in US-Iran relations. Reports of back-channel negotiations and mutual willingness to de-escalate have surfaced in recent weeks. These developments reduce geopolitical risk premiums, which typically support the US dollar as a safe-haven asset. As peace hopes rise, demand for the greenback declines.
Historically, the US dollar strengthens during periods of heightened geopolitical tension. Conversely, when tensions ease, capital flows out of the dollar and into higher-yielding or riskier assets. The current scenario mirrors this pattern. Investors now rotate into emerging market currencies, commodities, and equities, further pressuring the DXY.
Timeline of Key Events Driving the Shift
- October 2023: Indirect talks between US and Iranian officials resume in Oman, signaling a potential thaw.
- November 2023: Iran agrees to halt uranium enrichment above 60%, a key US demand.
- December 2023: US eases sanctions on Iranian oil exports as a goodwill gesture.
- January 2024: Both sides announce a framework for comprehensive negotiations, sparking a sharp sell-off in the DXY.
Each milestone reduces the perceived risk of conflict in the Middle East. As a result, the dollar loses its safe-haven appeal. The DXY bearish outlook now reflects this fundamental shift in investor sentiment.
Impact on Global Forex Markets and Commodities
The US Dollar Index’s weakness ripples across global markets. A weaker dollar benefits commodities priced in USD, such as gold, oil, and copper. Gold prices have already rallied above $2,050 per ounce, partly driven by the dollar’s decline. Similarly, crude oil prices have stabilized despite OPEC+ production cuts, as the dollar’s slide makes oil cheaper for non-US buyers.
Emerging market currencies also gain ground. The Mexican peso, Brazilian real, and South African rand have all strengthened against the dollar. This trend supports carry trade strategies, where investors borrow in low-yielding currencies like the dollar and invest in higher-yielding emerging market assets. Consequently, the US Dollar Index price forecast influences portfolio allocation decisions worldwide.
Expert Perspectives on the Dollar’s Trajectory
Analysts at major investment banks have revised their DXY forecasts downward. Morgan Stanley now targets 96.00 by mid-2024, citing the peace process as a key driver. Goldman Sachs echoes this view, noting that a resolution to US-Iran tensions could reduce the dollar’s risk premium by 2-3%. These expert assessments add weight to the bearish case.
However, some analysts caution that the peace process remains fragile. Any breakdown in talks could reverse the dollar’s decline quickly. Therefore, traders must monitor diplomatic developments closely. The DXY bearish outlook is conditional on continued progress in US-Iran relations.
Technical Analysis: Key Levels to Watch
Below 98.50, the next support zone lies at 97.60, the November 2023 low. A break below that level opens the door to 96.80, the 50% Fibonacci retracement. On the upside, resistance now stands at 98.50 and 99.20. A close above 99.20 would invalidate the bearish setup and suggest a false breakdown.
| Level | Price | Significance |
|---|---|---|
| Resistance 2 | 99.20 | November high, trendline resistance |
| Resistance 1 | 98.50 | 38.2% Fibonacci, psychological level |
| Support 1 | 97.60 | November low, prior support |
| Support 2 | 96.80 | 50% Fibonacci retracement |
Volume profile analysis shows high trading activity at 98.50, confirming its importance. A daily close below 97.60 would likely trigger stop-loss orders, accelerating the decline. Conversely, a bounce from 97.60 could provide a short-term buying opportunity for dollar bulls.
Broader Economic Context: Fed Policy and Inflation
The Federal Reserve’s monetary policy stance also influences the DXY. With inflation cooling but still above the 2% target, the Fed has maintained a cautious tone. Rate cuts are not imminent, which typically supports the dollar. However, the geopolitical factor now outweighs interest rate differentials. The US Dollar Index price forecast thus reflects a unique convergence of technical and fundamental forces.
Market pricing for Fed rate cuts in 2024 has actually increased slightly, with futures implying a 60% chance of a cut by June. This dovish expectation further weighs on the dollar. Combined with the peace hopes, the dollar faces a dual headwind: reduced safe-haven demand and lower yield expectations.
Conclusion
The US Dollar Index price forecast remains bearish as long as the index trades below the 98.50 resistance and the 38.2% Fibonacci retracement. Renewed US-Iran peace hopes have fundamentally altered the safe-haven demand landscape, driving capital away from the greenback. Technical indicators confirm the shift, with volume and momentum supporting further downside. Traders should watch the 97.60 support level closely, as a break below it could accelerate the decline toward 96.80. While risks remain, the current setup favors a continued bearish trajectory for the DXY.
FAQs
Q1: What is the US Dollar Index (DXY) and why is it important?
The US Dollar Index (DXY) measures the value of the US dollar against a basket of six major currencies: the euro, Japanese yen, British pound, Canadian dollar, Swedish krona, and Swiss franc. It is important because it provides a benchmark for the dollar’s global strength, influencing forex markets, commodity prices, and international trade.
Q2: How do US-Iran peace hopes affect the DXY?
Peace hopes reduce geopolitical risk, which diminishes demand for safe-haven assets like the US dollar. When tensions ease, investors shift capital into riskier assets, weakening the dollar. This dynamic is a key driver of the current bearish outlook for the DXY.
Q3: What is the significance of the 38.2% Fibonacci retracement level?
The 38.2% Fibonacci retracement is a technical analysis tool used to identify potential support or resistance levels. In the DXY’s case, it aligns with the 98.50 psychological level, creating a strong resistance zone. A sustained break below this level signals a trend reversal.
Q4: What are the next key support levels for the DXY?
Below 98.50, the next support levels are 97.60 (November 2023 low) and 96.80 (50% Fibonacci retracement). A break below 97.60 would confirm the bearish trend and open the door to further declines.
Q5: Could the DXY reverse its bearish trend?
Yes, if the US-Iran peace process collapses or if the Federal Reserve signals a more hawkish stance, the dollar could regain strength. A close above 99.20 would invalidate the bearish setup. Traders should monitor diplomatic developments and Fed commentary closely.
Disclaimer: The information provided is not trading advice, Bitcoinworld.co.in holds no liability for any investments made based on the information provided on this page. We strongly recommend independent research and/or consultation with a qualified professional before making any investment decisions.