
Is Ethereum gearing up for a significant rally? After a dip below $2,200, ETH has shown remarkable strength, outperforming even Bitcoin. Let’s dive into the key price levels and technical indicators that could signal the next big move for Ethereum.
Ethereum’s Bullish Momentum: Can $2,550 Be Achieved?
Ethereum’s price is currently gaining momentum, trading comfortably above the $2,300 support zone. The question on every investor’s mind: is a surge to $2,550 within reach? Here’s a breakdown of the recent price action:
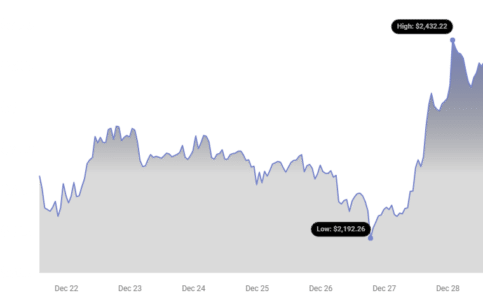
- ETH recovered strongly after briefly dipping below $2,200 to $2,192.
- The price broke through the $2,250 and $2,280 resistance levels.
- Bulls pushed the price above the $2,350 resistance, establishing a new multi-day high near $2,441.
- Currently, ETH is consolidating gains, trading above the 23.6% Fib retracement level of the upward move from $2,180 to $2,441.
At the time of writing, Ethereum is trading above $2,350 and the 100-hourly Simple Moving Average, indicating sustained bullish pressure. However, the $2,440 level poses immediate resistance.
Key Resistance Levels to Watch
- $2,440: The immediate resistance level. A break above this could trigger further gains.
- $2,500: A crucial psychological level. A sustained close above $2,500 could pave the way for a move towards $2,620.
- $2,620: A significant resistance zone. Surpassing this level could initiate another strong upward trend, potentially testing $2,700 and even $2,800.
See Also: Ethereum Wallet Linked To Donald Trump Moved $2.4M In Crypto To Coinbase
Potential Downside Risks for Ethereum
While the outlook appears bullish, it’s crucial to consider potential downside scenarios. Failure to break the $2,440 resistance could lead to a fresh decline. Key support levels to monitor include:
- $2,380: Initial support level, coinciding with a trend line.
- $2,320: A critical support zone, representing the 50% Fib retracement level from the recent swing low. A break below this level could signal a more significant correction.
- $2,200: A strong support level. A revisit to this level could occur if bearish momentum increases.
- $2,120: Further losses could potentially drive the price towards this level.
Technical Indicators to Consider
- Hourly MACD: Gaining momentum in the bullish zone, suggesting continued upward pressure.
- Hourly RSI: Currently above the 50 level, indicating positive momentum.
- Major Support Level: $2,320
- Major Resistance Level: $2,440
Are the Ethereum Bulls Truly in Control?
The recent price action suggests a strong presence of bulls in the Ethereum market. However, the cryptocurrency market is known for its volatility. Monitoring key resistance and support levels, along with technical indicators, is crucial for making informed investment decisions.
In Summary: Ethereum is showing bullish signs, with the potential to reach $2,550. However, traders should remain vigilant, considering potential downside risks and closely monitoring key technical indicators and price levels. Keep an eye on the $2,440 resistance; a break above this level could confirm the bullish trend.
Disclaimer: The information provided is not trading advice. Bitcoinworld.co.in holds no liability for any investments made based on the information provided on this page. We strongly recommend independent research and/or consultation with a qualified professional before making any investment decisions.
Disclaimer: The information provided is not trading advice, Bitcoinworld.co.in holds no liability for any investments made based on the information provided on this page. We strongly recommend independent research and/or consultation with a qualified professional before making any investment decisions.