
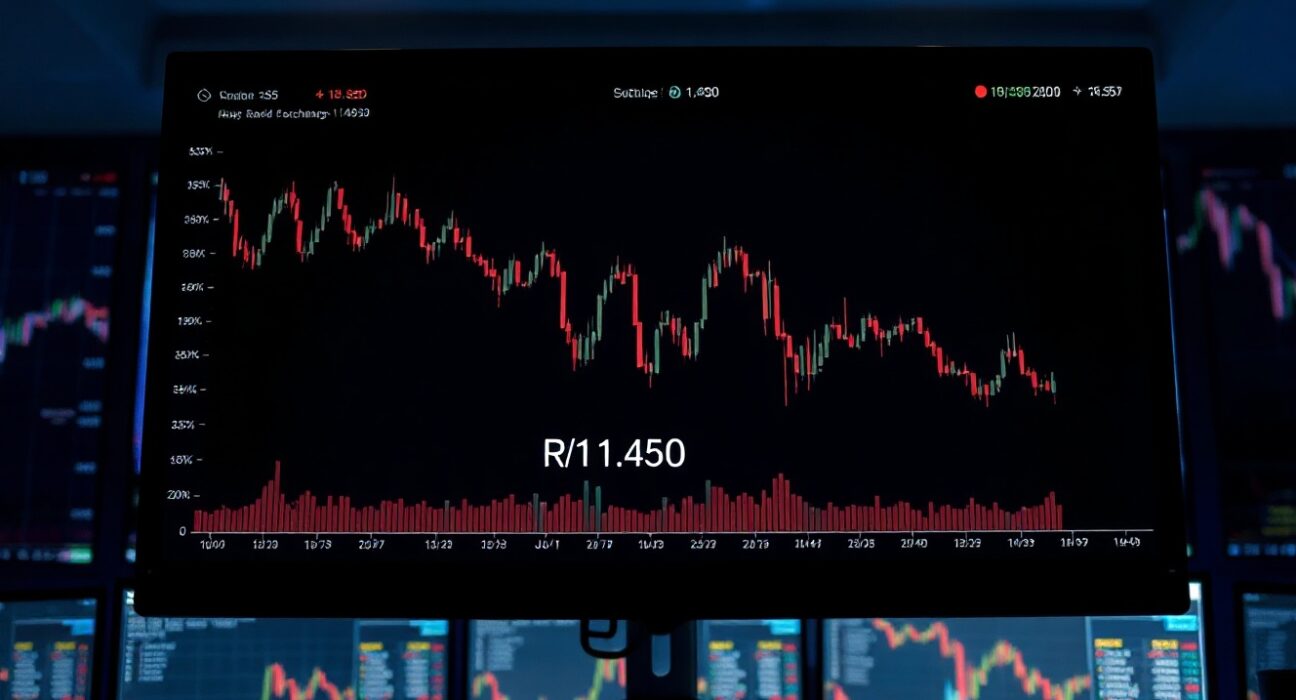
The EUR/USD currency pair extended its decline during Wednesday’s trading session, slipping toward the 1.1450 handle as persistent bearish momentum pushed prices to test the lower Bollinger Band support on the daily chart. The move marks a continuation of the recent downtrend, with sellers maintaining control amid a broadly stronger US dollar and shifting interest rate expectations.
Technical Breakdown: Lower Bollinger Band Under Pressure
The lower Bollinger Band, often viewed as a dynamic support level in trending markets, is currently being tested near 1.1440. A confirmed close below this band would signal an acceleration of bearish momentum, potentially opening the door toward the next support zone around 1.1380, a level that acted as resistance in early February. The middle Bollinger Band, representing the 20-day simple moving average, has flattened and is sloping slightly lower near 1.1580, reinforcing the bearish bias.
The Relative Strength Index (RSI) on the daily chart has dipped below 40, entering bearish territory but not yet oversold. This suggests room for further downside before exhaustion becomes a factor. Meanwhile, the Moving Average Convergence Divergence (MACD) indicator remains below its signal line with expanding red histogram bars, confirming that downside momentum is building.
Fundamental Context: Dollar Strength Weighs on Euro
The euro’s weakness comes against a backdrop of resilient US economic data that has tempered expectations for Federal Reserve rate cuts in the near term. Recent US jobless claims and manufacturing PMI figures have come in stronger than anticipated, supporting the dollar’s yield advantage. In contrast, the eurozone economy continues to show signs of sluggishness, with the European Central Bank maintaining a cautious stance on policy normalization.
Market pricing currently reflects a roughly 60% probability of a 25-basis-point rate cut by the ECB in June, while the Fed is seen holding rates steady through the third quarter. This policy divergence is providing underlying support for dollar-denominated assets and pressuring EUR/USD lower.
What This Means for Forex Traders
For active forex traders, the test of the lower Bollinger Band presents a critical juncture. A breakdown below the band on a daily closing basis would be a bearish signal, potentially triggering stop-loss orders and accelerating selling pressure. Conversely, if the band holds as support, a short-term bounce toward the 1.1520–1.1550 resistance zone could materialize, offering a counter-trend trading opportunity.
Traders should also monitor the 1.1450 level closely, as it represents a psychologically significant round number that often attracts option-related interest and algorithmic trading activity. A decisive break below this level would likely increase volatility and widen intraday ranges.
Conclusion
The EUR/USD pair remains under bearish pressure as it tests the lower Bollinger Band near 1.1450. With momentum indicators pointing lower and fundamental factors favoring the US dollar, the path of least resistance appears skewed to the downside. However, the band’s historical role as a support level means a bounce cannot be ruled out. Traders should watch for a daily close below 1.1440 as confirmation of further weakness, or a reversal back above 1.1520 as a signal of short-term stabilization.
FAQs
Q1: What is the significance of the lower Bollinger Band in EUR/USD trading?
The lower Bollinger Band is a volatility-based support level calculated two standard deviations below the 20-day simple moving average. When price touches or breaks below this band, it often indicates that the asset is oversold or that bearish momentum is intensifying. Traders watch for bounces off the band as potential reversal signals, or breakdowns as confirmation of a strong downtrend.
Q2: Why is the 1.1450 level important for EUR/USD?
The 1.1450 level is a psychologically significant round number that often acts as a support or resistance zone. It also aligns with prior swing lows from late January, making it a technical reference point for traders. A break below 1.1450 could trigger stop-loss orders and attract further selling, while a hold may lead to consolidation or a short-term rebound.
Q3: How do US economic data releases affect EUR/USD?
US economic data such as employment reports, GDP, and inflation figures influence expectations for Federal Reserve monetary policy. Stronger-than-expected data typically boosts the US dollar by raising the likelihood of higher-for-longer interest rates, which pressures EUR/USD lower. Conversely, weak data can weaken the dollar and support the euro.
Disclaimer: The information provided is not trading advice, Bitcoinworld.co.in holds no liability for any investments made based on the information provided on this page. We strongly recommend independent research and/or consultation with a qualified professional before making any investment decisions.