
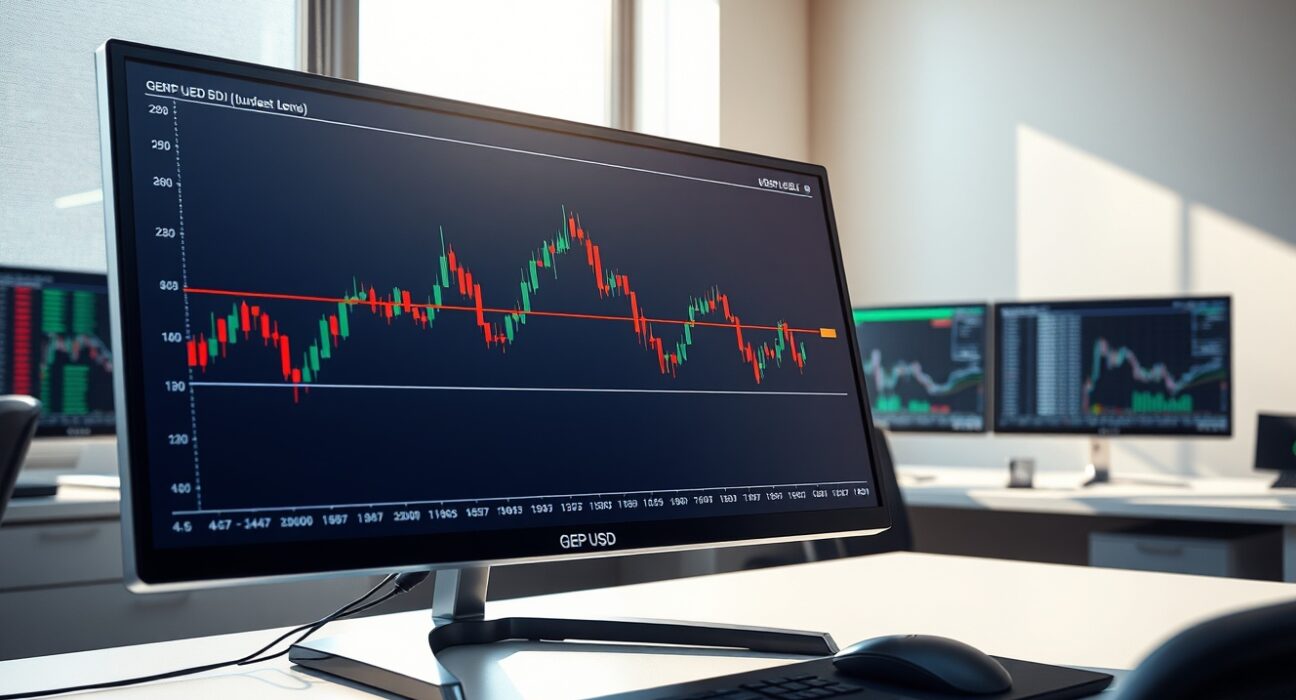
The GBP/USD currency pair, commonly known as ‘Cable,’ has encountered a significant technical barrier in recent trading sessions. Market data from London and New York on Thursday, March 13, 2025, confirms the pair’s rally has decisively halted near the psychologically and technically important 1.3600 level. This level coincides precisely with the 61.8% Fibonacci retracement drawn from a prior major swing high to low, creating a confluence of resistance that traders are watching closely for the next directional cue.
GBP/USD Forecast: Decoding the Fibonacci Halt at 1.3600
Fibonacci retracement levels are a cornerstone of modern technical analysis in forex markets. Traders use these ratios, derived from the Fibonacci sequence, to identify potential support and resistance zones. The 61.8% level, often called the ‘golden ratio,’ is particularly significant. Consequently, the rejection of price at this specific level on the GBP/USD chart carries substantial weight for market participants. The stall suggests that buying momentum from the recent uptrend may be exhausting itself. Furthermore, this development occurs amidst a complex backdrop of macroeconomic data from both the United Kingdom and the United States.
Technical Structure and Market Context
The current price action must be analyzed within its broader context. The rally that preceded this halt began from a notable swing low established in late February. Analysts at several major investment banks have published research notes highlighting the importance of the 1.3550-1.3650 zone. A failure to break above 1.3600 consistently could signal a near-term reversal. Conversely, a decisive daily close above this Fibonacci barrier would open the path toward higher resistance targets. The chart below summarizes the key technical levels currently in play for Cable.
Key Technical Levels for GBP/USD
| Level | Type | Significance |
|---|---|---|
| 1.3600 | Resistance | 61.8% Fibonacci Retracement |
| 1.3550 | Support | Previous Swing High & 50% Fib |
| 1.3480 | Support | 38.2% Fibonacci Retracement |
| 1.3700 | Resistance | Psychological & Prior Structure |
Market sentiment, as measured by the Commitment of Traders (COT) reports, shows a recent increase in net long positions held by speculative traders. This positioning data often acts as a contrarian indicator at extreme levels. Therefore, the halt at resistance aligns with a potentially crowded long trade. Additionally, momentum indicators like the Relative Strength Index (RSI) are now testing overbought territory on the four-hour and daily charts. This convergence of factors increases the probability of consolidation or a pullback.
Fundamental Drivers and Economic Crosscurrents
Technical analysis does not exist in a vacuum. The fundamental landscape provides the engine for price movement. Recently, the British pound found support from marginally improved UK economic data and a perceived dovish shift by other major central banks. However, the US dollar’s own trajectory remains a dominant force. Upcoming US inflation prints and Federal Reserve commentary will directly influence dollar strength. Key fundamental factors currently impacting the GBP/USD forecast include:
- Bank of England Policy: Market pricing for the timing of the next BoE rate cut.
- UK Economic Data: Particularly wage growth, services PMI, and GDP revisions.
- US Dollar Index (DXY): Broad dollar strength as a counterweight to GBP moves.
- Risk Sentiment: Global equity market performance influencing capital flows.
Expert Analysis and Market Implications
Senior currency strategists emphasize the importance of the 1.3600 area. ‘This is a classic technical inflection point,’ noted a lead analyst from a European bank. ‘The market is essentially testing whether the recent pound strength has longer legs or was merely a corrective bounce within a larger range. A rejection here would likely see a retest of support near 1.3450.’ This view is echoed by trading desk commentary, which reports increased option hedging activity around the 1.3600 strike price for upcoming expiries. The implication for traders is clear: risk management is paramount around such defined technical levels.
Conclusion
The GBP/USD forecast now hinges critically on price action around the 1.3600 Fibonacci retracement level. The rally’s halt at this precise technical confluence signals a moment of equilibrium between bullish and bearish forces. Traders and investors should monitor for either a confirmed breakout above this barrier or a rejection lower to determine the next medium-term directional bias. This technical development, set against a fluid fundamental backdrop, underscores the dynamic and interconnected nature of the global foreign exchange market. The coming sessions will be crucial for establishing whether this level acts as a springboard or a ceiling for the British pound.
FAQs
Q1: What is the 61.8% Fibonacci retracement level?
The 61.8% Fibonacci retracement, also known as the golden ratio, is a key technical analysis tool. Traders draw it between a significant price high and low. The level at 61.8% of that range often acts as strong support or resistance, indicating where a prior trend’s pullback might stall or reverse.
Q2: Why is the 1.3600 level specifically important for GBP/USD?
The 1.3600 level is important because it represents a confluence of technical factors. It is not only a major psychological round number but also precisely aligns with the calculated 61.8% Fibonacci retracement from a prior key market swing. Such confluences attract heightened attention from algorithmic and discretionary traders.
Q3: What happens if GBP/USD breaks above 1.3600?
A decisive and sustained daily close above 1.3600 would be considered a bullish technical breakout. This action would likely trigger further buying, setting the stage for a test of the next resistance levels, such as 1.3700 or the 78.6% Fibonacci retracement. It would invalidate the current bearish rejection signal.
Q4: What fundamental factors could help GBP break higher?
Fundamentally, a stronger break above 1.3600 could be fueled by a combination of surprisingly strong UK economic data, a more hawkish shift in tone from the Bank of England, or a pronounced weakening of the US dollar due to dovish Federal Reserve expectations or softer US inflation data.
Q5: How do traders use this information?
Traders use this technical setup to plan risk-managed trades. Some may look to sell near 1.3600 with a stop-loss above it, anticipating a rejection. Others may wait for a confirmed breakout above the level to enter long positions, targeting higher resistances. Position sizing and stop-loss orders are crucial due to the increased volatility near such key levels.
Disclaimer: The information provided is not trading advice, Bitcoinworld.co.in holds no liability for any investments made based on the information provided on this page. We strongly recommend independent research and/or consultation with a qualified professional before making any investment decisions.