

Buckle up, crypto enthusiasts! The market is heating up, and Bitcoin just made a significant leap, smashing through the $32,400 barrier. Did you see that coming? After weeks of anticipation and speculation, it seems the bulls are firmly in charge, fueled by growing excitement around a potential Bitcoin spot ETF. But in this fast-paced world of crypto, fortunes can change in a heartbeat. So, is this the start of a massive bull run, or is it a fleeting moment to secure profits? And what about your favorite altcoins? Are they riding Bitcoin’s wave, or carving their own paths? Let’s dive deep into the charts of the top 10 cryptocurrencies to decipher the signals and navigate this exciting market.
Bitcoin’s Bullish Breakout: Is $40K Next?
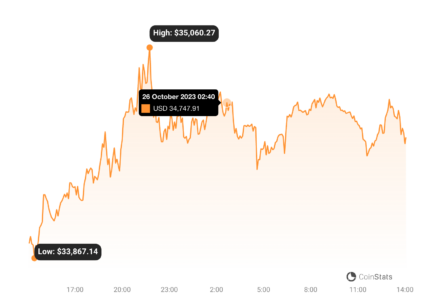
Bitcoin (BTC) has been making headlines, and for good reason! On October 23rd, it didn’t just nudge past the $31,000 resistance – it soared right through to $32,400. This powerful move has sent the Relative Strength Index (RSI) into overbought territory. Now, while that might usually signal caution, in a potential early bull market, an elevated RSI can be sustained for a while. Think of it as the market flexing its newfound muscle!
https://coinstats.app/coins/bitcoin/
Key Bitcoin Levels to Watch:
- Support Zones: Keep a close eye on $32,400 and $31,000. These levels are now critical support. If Bitcoin dips, expect buyers to defend these zones vigorously.
- Bullish Target: A rebound from the support could propel BTC towards $40,000. Imagine the gains!
- Bearish Signal: A fall below $31,000 might suggest a bull trap, and we could see a deeper correction.
Ethereum (ETH): Ready to Break $2,000?
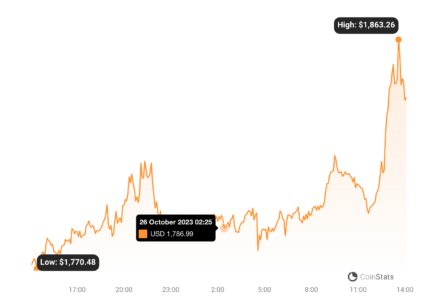
Ethereum (ETH) is showing signs of life! It broke above the $1,746 resistance on October 23rd, hinting at a potential trend change. However, the bulls faced some pushback at higher levels on October 24th. The $1,746 mark is now the crucial support level to watch.
https://coinstats.app/coins/ethereum/
Ethereum’s Potential Paths:
- Bullish Scenario: If ETH holds above $1,746, we could see a surge towards $1,855, then potentially $1,900 and even $2,000. Think about the ETH/BTC pair implications!
- Bearish Scenario: Bears might try to push the price back below $1,746. This could lead to a retest of the 20-day EMA around $1,648, suggesting more sideways movement.
Binance Coin (BNB): Stuck in a Range?
Binance Coin (BNB) saw a pop above $223 on October 23rd, but the momentum stalled around $235. Sellers are trying to pull the price back down, suggesting BNB might be stuck in a $203 to $235 range for a while. Is BNB taking a breather before its next move?
https://coinstats.app/coins/binance-coin/
BNB’s Key Indicators:
- Bullish Signs: The 20-day EMA is turning up, and the RSI is positive, indicating bulls still have an edge. A bounce from $223 could fuel a rally towards $250 and then $265.
- Range Bound: Failure to hold $223 might confirm the range-bound movement.
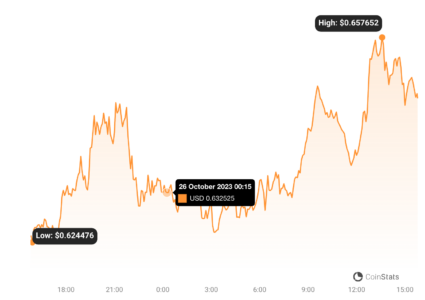
XRP: Breaking Free or Range-Bound?
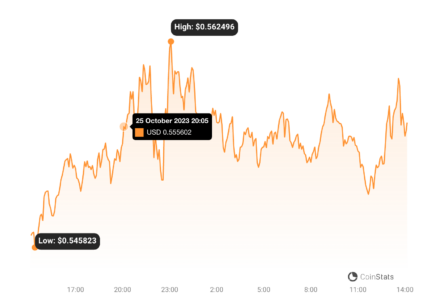
XRP has been trading between $0.41 and $0.56 for months. On October 24th, bulls briefly pushed above $0.56, but faced immediate selling pressure. Are we finally seeing an XRP breakout, or is it another fakeout?
https://coinstats.app/coins/ripple/
XRP’s Potential Scenarios:
- Range Continuation: A move back towards the moving averages could mean XRP stays within the $0.46-$0.56 range.
- Bullish Breakout: If the price turns up and decisively breaks above $0.56, it could signal a new uptrend, potentially targeting $0.66, and then $0.71. XRP army, are you ready?
Solana (SOL): Soaring to New Heights?
Solana (SOL) hit its $32.81 target on October 23rd, prompting some profit-taking. However, any dips were quickly bought up, showcasing strong bullish sentiment. Solana broke above $32.81 on October 25th – is this the next leg up?
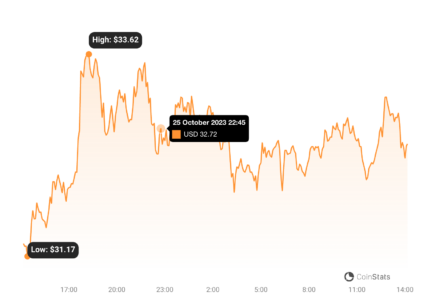
https://coinstats.app/coins/solana/
Solana’s Trajectory:
- Uptrend Continues: The break above $32.81 suggests the uptrend is resuming.
- Potential Correction: The overbought RSI hints at a possible minor correction or consolidation. Support levels to watch are $29.50 and $27.12.
Cardano (ADA): Consolidation or Breakout Imminent?
Cardano (ADA) climbed above $0.28 resistance on October 24th, but faced resistance from bears. The $0.28 level seems to be a battleground, potentially leading to consolidation between $0.24 and $0.28. Will ADA break free?
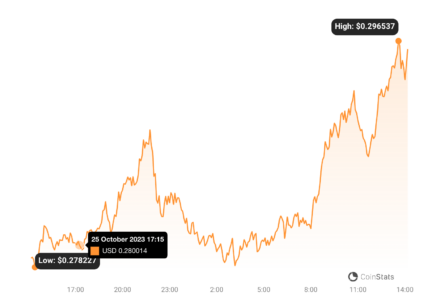
https://coinstats.app/coins/cardano/
Cardano’s Next Moves:
- Consolidation Likely: Struggling near $0.28 could mean ADA consolidates further.
- Bullish Break: If ADA rebounds from $0.28 and pushes past $0.30, it could signal a new uptrend targeting $0.32 and potentially $0.38.
Dogecoin (DOGE): Meme Magic Fading or Holding Strong?
Dogecoin (DOGE) met selling pressure at $0.07 on October 24th. A correction or consolidation seems likely in the short term. However, if DOGE holds its ground, it could signal bullish resilience. Is the Doge army still HODLing?
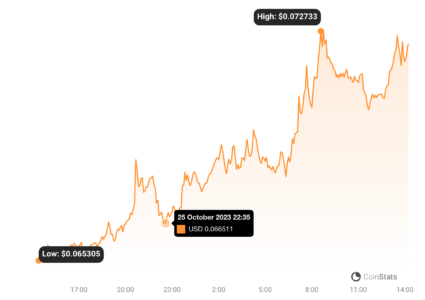
https://coinstats.app/coins/dogecoin/
Dogecoin’s Key Signals:
- Potential Breakout: Holding above key levels could set the stage for a breakout above $0.07, potentially reaching $0.08.
- Bearish Threat: A drop below $0.06 could shift the advantage to the bears.
Toncoin (TON): Ready to Challenge $2.60 Again?
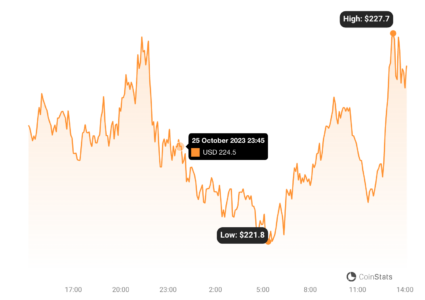
Toncoin (TON) faced resistance at $2.26 on October 24th, with bears defending the $2.31 level. The moving averages are providing initial support. Can TON overcome this hurdle and retest higher resistance?
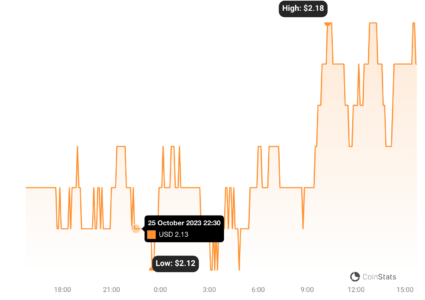
https://coinstats.app/coins/the-open-network/
Toncoin’s Potential Directions:
- Bullish Rebound: A bounce from the moving averages could indicate strong buying interest and increase the chances of breaking $2.31, potentially retesting $2.59.
- Consolidation Risk: A drop below the moving averages might lead to consolidation between $1.89 and $2.31.
Chainlink (LINK): Targeting $15?
Chainlink (LINK) broke out of a multi-month consolidation on October 22nd, surging past $9.50. Sellers tried to push it back down on October 24th, but buyers stepped in. LINK is continuing its ascent – is $15 in sight?
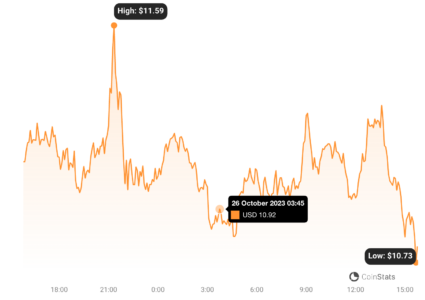
https://coinstats.app/coins/chainlink/
Chainlink’s Bullish Momentum:
- Strong Uptrend: The breakout from $9.50 has a pattern target of $13.50, with potential to reach $15.
- Overbought Caution: The RSI is overbought, suggesting a possible short-term correction or consolidation.
Polygon (MATIC): New Uptrend or False Breakout?
Polygon (MATIC) broke above $0.60 resistance on October 22nd, signaling potential accumulation. The 20-day EMA is turning up, and the RSI is overbought. Is MATIC starting a new uptrend, or is this a bull trap?
https://coinstats.app/coins/matic-network/
Polygon’s Critical Levels:
- Bullish Confirmation: Holding above $0.60 would confirm a new uptrend, potentially targeting $0.70 and then $0.80.
- Bearish Warning: Falling below $0.60 could indicate a false breakout and lead to a pullback to the moving averages.
Stay Informed, Trade Smart!
The cryptocurrency market is buzzing with activity! Bitcoin’s surge past $32,400 has injected a dose of optimism, and altcoins are reacting in their own unique ways. Remember, this is a dynamic and ever-changing market. Keep a close watch on these key price levels, support and resistance zones, and market indicators. Whether you’re a seasoned trader or just starting your crypto journey, staying informed is your best strategy to navigate the exciting opportunities and potential risks. Happy trading, and may the charts be ever in your favor!
Disclaimer: The information provided is not trading advice, Bitcoinworld.co.in holds no liability for any investments made based on the information provided on this page. We strongly recommend independent research and/or consultation with a qualified professional before making any investment decisions.