

Is Lido DAO (LDO) finally turning the tide? After a week of minor dips, the price of LDO has perked up, showing a 3.25% increase in the last 24 hours, currently sitting at $2.84. This uptick comes as a welcome change from the previous week’s slight decline of 1.0%, where the price gently slid from $2.89. Let’s dive into what’s driving these price movements and what it could mean for LDO.
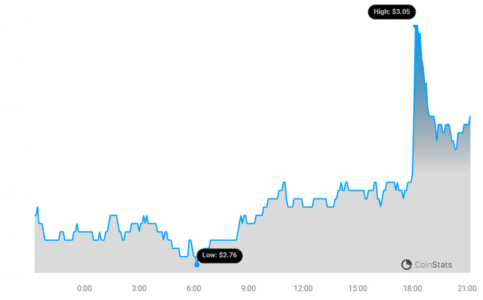 LDO Price Chart | Source: Coinstats
[/caption>
For context, LDO once reached an all-time high of $7.30. While the current price is significantly below this peak, any positive movement is noteworthy in the volatile crypto market.
See Also: Price Analysis: Kaspa (KAS) Price Up More Than 10% In 24 Hours
Decoding LDO’s Price Swings: Daily vs. Weekly Volatility
To better understand LDO’s recent performance, let’s compare its price fluctuations over the last day versus the last week. The charts below visually represent this, giving us insights into the coin’s volatility.
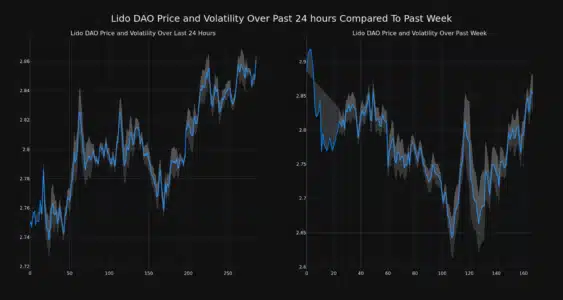 LDO Price and Volatility Chart
[/caption>
Notice those gray bands in the charts? Those are Bollinger Bands, a handy tool for measuring volatility. Think of them as dynamic ranges that adapt to price movements.
Bollinger Bands Explained:
- What they are: They consist of a middle band (usually a 20-day simple moving average) and two outer bands calculated based on the standard deviation of the price.
- Volatility Indicator: Wider bands mean higher volatility, indicating more significant price swings. Narrower bands suggest lower volatility, with prices being more stable.
- Reading the Chart: When you see a wider gray area on the chart, it signals increased volatility for LDO during that period.
By looking at these bands, we can quickly grasp how much LDO’s price has been fluctuating, both daily and weekly.
Trading Volume Dips While Circulating Supply Sees a Minor Increase
Interestingly, while the price shows a recent positive blip, the trading volume for LDO has actually decreased by 13.0% over the past week. Concurrently, the circulating supply of LDO has slightly increased by 0.04%.
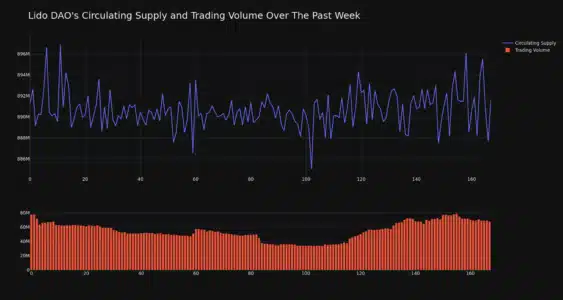 LDO Circulating Supply and Trading Volume
[/caption>
Let’s break down what these shifts mean:
- Decreased Trading Volume: A drop in trading volume could suggest less interest in trading LDO at the moment. It might also indicate that the recent price increase isn’t backed by strong buying pressure.
- Slight Increase in Circulating Supply: The 0.04% increase brings the circulating supply to 890.93 million LDO. This represents a substantial 89.09% of its total max supply of 1.00 billion tokens. A slight increase in supply could, theoretically, put minor downward pressure on price, all else being equal. However, in this case, the price has still risen, suggesting other factors are at play.
LDO’s Market Standing
Currently, Lido DAO holds the #37 rank in market capitalization, boasting a market cap of $2.55 billion. This ranking places LDO among the top cryptocurrencies in the market, reflecting its significant presence in the DeFi space, particularly in liquid staking.
Key Takeaways and What to Watch For
- Recent Price Rebound: LDO has shown a positive price movement in the last 24 hours, counteracting a slight weekly downtrend.
- Volatility Remains: Bollinger Bands highlight ongoing volatility in LDO’s price. Traders should be aware of these potential price swings.
- Trading Volume Dip: The decrease in trading volume alongside a price increase warrants attention. Is this a temporary bounce, or is stronger momentum building?
- Supply Increase: A minor increase in circulating supply has occurred, but its impact seems to be overshadowed by other market forces in the short term.
Disclaimer: The information provided here is for informational purposes only and should not be considered financial advice. Cryptocurrency trading involves substantial risk of loss. Always conduct thorough independent research and consult with a qualified financial advisor before making any investment decisions. Bitcoinworld.co.in is not liable for any trading or investment outcomes based on this analysis.
#Binance #WRITE2EARN
Disclaimer: The information provided is not trading advice, Bitcoinworld.co.in holds no liability for any investments made based on the information provided on this page. We strongly recommend independent research and/or consultation with a qualified professional before making any investment decisions.