

Litecoin (LTC) is under pressure! After failing to break past the $72.40 resistance, LTC has entered a decline. Is this a temporary dip or the start of a bigger downtrend? Let’s dive into the technical analysis to understand what’s next for Litecoin.
Litecoin (LTC) Price: What’s Happening?
- Fresh Decline: LTC started a new downtrend after being rejected at the $72.00 resistance level.
- Below Key Levels: The price is currently trading below $68.00 and the 55-period simple moving average (SMA) on the 4-hour chart.
- Bearish Trendline: A significant bearish trendline is forming with resistance around $69.00 on the 4-hour chart of the LTC/USD pair.
- Critical Support: The bulls need to defend the $63.20 support zone to prevent further losses.
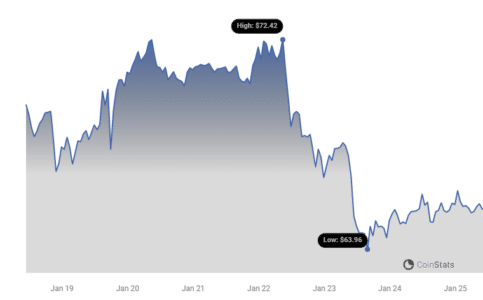
In the past few sessions, Bitcoin, Ethereum, Ripple, and Litecoin have all experienced sharp declines against the US Dollar. Previously, LTC struggled to clear the $72.40 resistance and started a fresh decline.
The price broke the $70.00 support zone to enter a bearish zone. The bears even pushed the price below the $65 support zone. It tested the $63.20 zone.
A low has formed near $63.13, and the price is now consolidating losses. It is now trading below $70.00 and the 55 simple moving average (4 hours).
Immediate resistance is near the $67.80 level. It is close to the 50% Fib retracement level of the downward move from the $72.61 swing high to the $63.13 low.
See Also: Price Analysis: SOL Price Recovery May Not Last Unless Solana Clears This Hurdle
The next major resistance is near the $69.00 level or the 61.8% Fib retracement level of the downward move from the $72.61 swing high to the $63.13 low.
There is also a key bearish trend line forming with resistance near $69.00 on the 4-hour chart of the LTC/USD pair.
A clear move above the $69.00 level could pump the price toward the $72.50 level. The next major resistance could be $75.00. On the downside, immediate support is near the $64.25 level.
The next key support is near the $63.20 level. If there is a downside break below the $63.20 support, the price could accelerate lower toward the $60.00 level in the near term.
Looking at the chart, Litecoin price is clearly trading below $70.00 and the 55 simple moving average (4 hours). Overall, the price could continue to move down if it stays below the $69.00 resistance zone.
Technical Indicators: What are they saying?
- 4 hours MACD – The MACD for LTC/USD is now losing pace in the bearish zone.
- 4 hours RSI (Relative Strength Index) – The RSI for LTC/USD is now below the 50 level.
Key Price Levels to Watch
Keeping an eye on these levels can help you anticipate potential price movements.
- Key Support Levels – $64.25 and $63.20.
- Key Resistance Levels – $67.80 and $69.00.
What’s Next for Litecoin (LTC)?
Litecoin’s price action is currently bearish, with the price struggling below key resistance levels. The $63.20 support is crucial for preventing further declines. If the bulls can’t defend this level, we could see LTC heading towards $60.00. On the upside, a break above $69.00 could signal a potential recovery towards $72.50 and $75.00.
Disclaimer: The information provided is not trading advice, Bitcoinworld.co.in holds no liability for any investments made based on the information provided on this page. We strongly recommend independent research and/or consultation with a qualified professional before making any investment decisions.