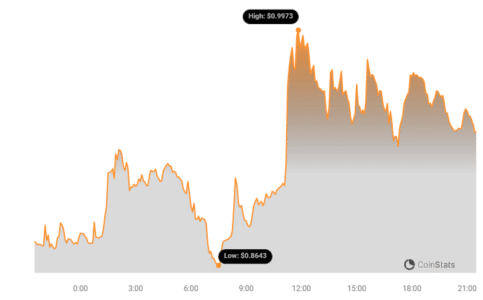
Cryptocurrency markets are known for their volatility, and today, all eyes are on Sei (SEI) as it experiences a significant surge. In the last 24 hours, the price of SEI has jumped by a notable 9.35%, reaching $0.95. This impressive climb has caught the attention of traders and investors alike. But is this just a short-term pump, or is there more to this upward trend? Let’s dive into the details.
SEI’s Weekly Performance: A Whopping 49% Increase!
Looking beyond the daily gains, SEI’s performance over the past week is even more remarkable. The price has surged by over 49.0%, climbing from $0.64 to its current price point. This substantial increase indicates strong positive momentum for SEI in the short term. Such a significant weekly jump often sparks interest and speculation within the crypto community.
See Also: Price Analysis: Sui (SUI) Price Down More Than 3% Within 24 Hours
Chasing the All-Time High
Currently, SEI is trading close to its all-time high of $1.00. As the price inches closer to this milestone, the question on everyone’s mind is: Will SEI break through and set a new record? Reaching and surpassing the all-time high can be a significant psychological barrier, and overcoming it could potentially trigger further price appreciation.
Decoding SEI’s Price Movements and Volatility
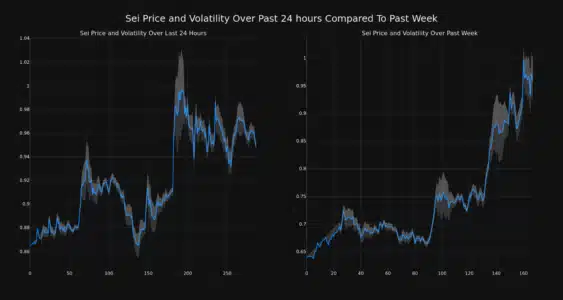
To understand the dynamics of SEI’s price action, examining price and volatility charts is crucial. The following chart provides a visual representation of SEI’s price movement and volatility over the last 24 hours (left) compared to the past week (right).
Understanding Bollinger Bands and Volatility
The gray bands in the chart are Bollinger Bands, a popular technical analysis tool used to measure volatility. Here’s a simple breakdown:
- Bollinger Bands Explained: These bands essentially measure the standard deviation of price movements over a period.
- Width and Volatility: Wider bands indicate higher volatility, meaning the price is experiencing larger swings. Conversely, narrower bands suggest lower volatility with less price fluctuation.
- Gray Area Interpretation: The larger the gray area between the bands at any point, the greater the volatility during that period.
By observing the Bollinger Bands, we can gauge the level of risk and potential price swings associated with SEI trading in both the short-term (daily) and medium-term (weekly).
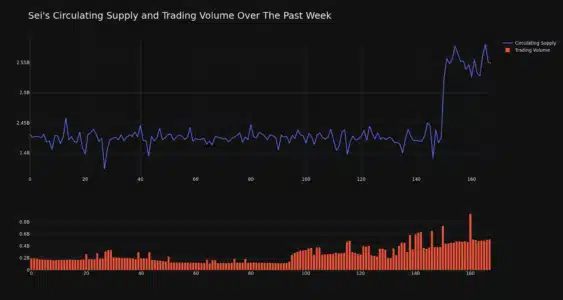
Trading Volume and Circulating Supply: Key Indicators
Another important aspect to consider is trading volume and circulating supply. SEI’s trading volume has seen a substantial increase, climbing by 160.0% over the past week. Interestingly, this surge in trading volume aligns with an increase in the coin’s circulating supply, which has risen by 4.84%.
What Does This Mean?
- Increased Circulating Supply: The circulating supply now stands at 2.55 billion SEI coins. An increase in circulating supply can sometimes dilute the price, but in this case, the significant demand, reflected in the increased trading volume, seems to be overpowering this potential dilution.
- Trading Volume Surge: A 160% jump in trading volume is a strong signal of heightened market activity and interest in SEI. This could be driven by various factors, including positive news, increased investor attention, or broader market trends.
SEI’s Market Cap Ranking
According to the latest data, SEI currently holds the #45 rank in market capitalization, with a market cap of $2.42 billion. This ranking places SEI firmly within the top tier of cryptocurrencies, highlighting its growing market presence and investor confidence.
In Conclusion: SEI’s Bullish Momentum
SEI’s recent price surge, coupled with increased trading volume and circulating supply, paints a picture of strong bullish momentum. While the cryptocurrency market is inherently volatile, SEI’s impressive 24-hour and weekly performance indicates significant positive interest. Keep an eye on whether SEI can break through its all-time high and sustain this upward trajectory.
Disclaimer: The information provided is not trading nor financial advice. Bitcoinworld.co.in holds no liability for any trading or investments made based on the information provided on this page. We strongly recommend independent research and/or consultation with a qualified professional before making any trading or investment decisions.
#Binance #WRITE2EARN
Disclaimer: The information provided is not trading advice, Bitcoinworld.co.in holds no liability for any investments made based on the information provided on this page. We strongly recommend independent research and/or consultation with a qualified professional before making any investment decisions.