

Hey crypto enthusiasts! Ever wake up and check your portfolio, only to see a coin you’re watching has taken a little dip? That’s the rollercoaster of the crypto market for you! Today, we’re diving into Immutable X (IMX), a project that’s been making waves in the NFT and gaming space. Let’s break down its recent price movements and see what’s really going on.
Immutable X (IMX) Price Check: What’s the Latest?
Over the last 24 hours, the price of Immutable (IMX) has seen a decrease of 3.62%, settling at around $3.46. Now, seeing red in your portfolio can be a bit unsettling, but before you panic, let’s put this into perspective.
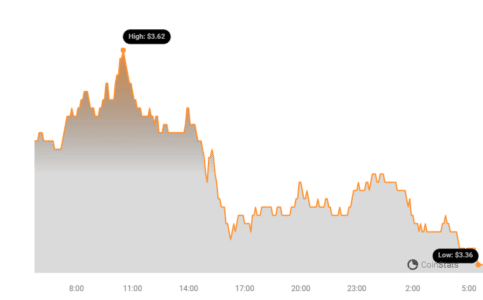
As you can see from the chart above, this 24-hour dip is a bit of a contrast to what we’ve seen over the past week. In fact, looking at the bigger picture, IMX has actually been on a positive trajectory.
Zooming Out: IMX’s Impressive Weekly Performance
Here’s the exciting part: despite the recent 24-hour pullback, Immutable X has actually experienced a significant 13.0% gain over the past week! The price climbed from around $3.04 to its current level. This paints a much more optimistic picture, suggesting that the recent dip might just be a temporary fluctuation in a larger upward trend.
See Also: Price Analysis: The Price Of Polkadot (DOT) Increased More Than 3% Within 24 Hours
Volatility Check: Are Things Getting Bumpy for IMX?
To understand the price movements better, let’s talk about volatility. Volatility in crypto refers to how much and how quickly the price of a cryptocurrency changes. High volatility means prices can swing dramatically in short periods, while low volatility suggests more stable price movement.
The chart below gives us a visual representation of Immutable X’s price movement and volatility. The left side focuses on the past 24 hours, while the right side shows the past week.
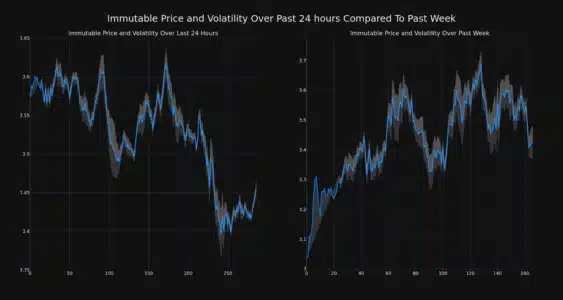
Notice those gray bands in the charts? Those are called Bollinger Bands. Think of them as volatility indicators. They essentially measure the ‘normal’ range of price fluctuations. When the bands are wider, it means volatility is higher, and when they are narrow, volatility is lower.
Key takeaway about Bollinger Bands:
- Wider Bands = Higher Volatility: Expect larger price swings.
- Narrower Bands = Lower Volatility: Price movements are generally calmer.
Looking at the charts, we can visually assess the volatility for both the daily and weekly price movements of IMX.
Trading Volume & Circulating Supply: What’s the Story?
Beyond price and volatility, two other important metrics to consider are trading volume and circulating supply. Let’s break down what they mean for IMX:
- Trading Volume: This is the total amount of IMX coins that have been traded over a specific period (in this case, the past week). A decrease in trading volume can sometimes indicate less interest or activity in the coin at the moment.
- Circulating Supply: This refers to the number of IMX coins that are currently available to be traded in the market. An increase in circulating supply means more coins are being released into circulation.
For Immutable X, the trading volume has decreased by a significant 37.0% over the past week. Simultaneously, the circulating supply of IMX has slightly increased by 0.25%, bringing the total to over 1.39 billion coins.
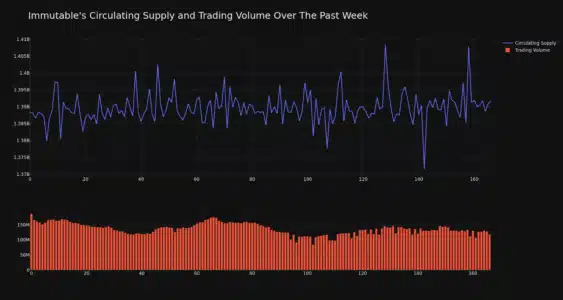
Currently, the circulating supply represents about 69.46% of IMX’s maximum possible supply of 2.00 billion coins. This is something to keep an eye on as it can potentially influence the coin’s price in the long run.
IMX Market Cap and Ranking: Where Does it Stand?
Market capitalization, or market cap, is a way to measure the size and value of a cryptocurrency. It’s calculated by multiplying the current price of a coin by its circulating supply.
As of now, Immutable X holds the #29 rank in market capitalization, with a market cap of approximately $4.80 billion. This puts IMX among the top cryptocurrencies in the market, reflecting its significant presence and adoption.
In Conclusion: Is the Dip a Buying Opportunity?
Immutable X has shown a slight dip in price over the last 24 hours, but it’s crucial to remember the bigger picture. The coin has demonstrated a strong 13% gain over the past week, suggesting underlying positive momentum. While the trading volume has decreased, and the circulating supply has slightly increased, IMX maintains a strong market cap ranking.
Key Points to Remember:
- Short-term Dip, Long-term Gain?: The 24-hour dip contrasts with a positive weekly trend.
- Volatility is Normal: Crypto markets are volatile; Bollinger Bands help visualize this.
- Supply & Demand Factors: Changes in trading volume and circulating supply can influence price.
- Strong Market Position: IMX remains a top-ranked cryptocurrency by market cap.
As always, remember that the crypto market is dynamic and unpredictable. Price analysis like this gives us a snapshot of what’s happening, but it’s not financial advice. Always do your own thorough research and consider consulting with a financial advisor before making any investment decisions.
Disclaimer: The information provided is not trading advice. Bitcoinworld.co.in holds no liability for any investments made based on the information provided on this page. We strongly recommend independent research and/or consultation with a qualified professional before making any investment decisions.
#Binance #WRITE2EARN
Disclaimer: The information provided is not trading advice, Bitcoinworld.co.in holds no liability for any investments made based on the information provided on this page. We strongly recommend independent research and/or consultation with a qualified professional before making any investment decisions.