Navigating the crypto market can feel like riding a rollercoaster, and Injective (INJ) is currently showcasing just that! While the broader crypto sphere keeps us on our toes, let’s zoom in on INJ to understand its recent price movements and what they might signal. Is the recent dip a cause for concern, or just a temporary breather before another surge? Let’s break down the latest Injective price analysis.
Injective (INJ) Price: A Snapshot of Recent Performance
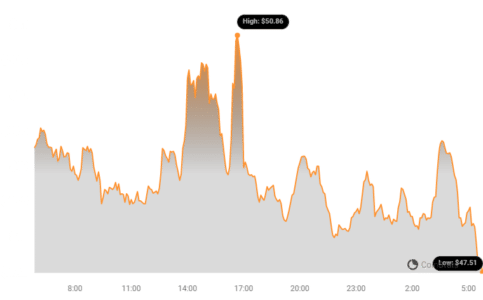
Over the last 24 hours, the price of Injective (INJ) has experienced a downturn, decreasing by 5.22% to land at $49.05. This short-term pullback might have caught some traders off guard, especially considering the positive momentum INJ has shown recently.
Zooming Out: INJ’s Impressive Weekly Growth
However, to get a clearer picture, it’s crucial to look beyond just the last 24 hours. When we broaden our view to the past week, Injective’s performance paints a much rosier picture. In the last seven days, INJ has been on a strong uptrend, climbing by a significant 25.0%. This impressive surge has propelled the price from $39.27 to its current level, demonstrating robust bullish momentum in the medium term.
See Also: Price Analysis: The Price Of Immutable (IMX) Deceased More Than 3% Within 24 Hours
Decoding Volatility: Daily vs. Weekly Price Movements
To understand the dynamics at play, let’s delve into price volatility. The chart below offers a visual comparison of Injective’s price fluctuations and volatility over both the last 24 hours (left) and the past week (right).
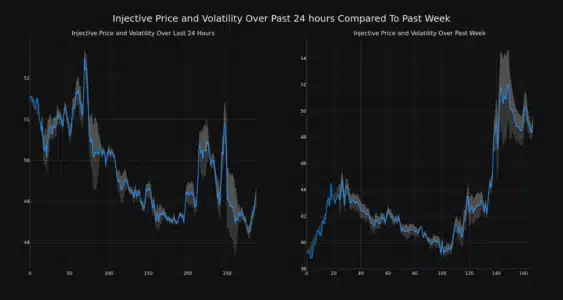
Notice those gray bands in the charts? Those are Bollinger Bands, a handy tool used to measure market volatility. They essentially show the range within which the price of INJ has been fluctuating. The wider these bands are, the higher the volatility. As you can see, the volatility might appear different when comparing the daily and weekly charts, giving us insights into short-term versus medium-term price swings.
Trading Volume and Circulating Supply: Key Indicators
Beyond price movements, let’s consider other crucial metrics. Interestingly, the trading volume for INJ has increased by a substantial 23.0% over the past week. This surge in trading activity suggests heightened interest and participation in the INJ market.
On the other hand, the circulating supply of INJ has slightly decreased by 0.13% during the same period. This divergence between rising trading volume and a slightly shrinking circulating supply can sometimes indicate potential upward pressure on price, as increased demand meets slightly reduced availability.
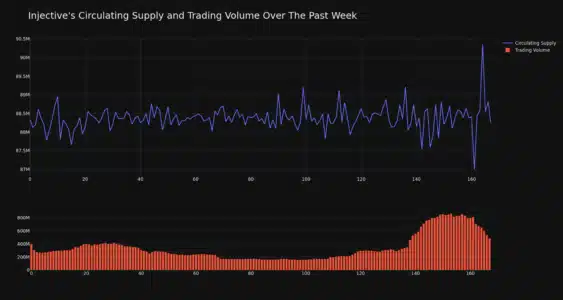
Currently, the circulating supply of INJ stands at 88.39 million coins.
INJ Market Cap and Ranking
According to the latest data, Injective’s market capitalization is currently ranked at #35, boasting a significant market cap of $4.33 billion. This ranking underscores INJ’s position as a prominent player in the cryptocurrency market.
Key Takeaways and What to Watch
- Short-Term Dip, Medium-Term Growth: Injective (INJ) has experienced a 24-hour price decrease, but maintains a strong 25% uptrend over the past week. This suggests the recent dip might be a short-term correction within a larger bullish trend.
- Increased Volatility: Price charts indicate ongoing volatility, which is typical in the crypto market. Traders should be aware of these fluctuations.
- Rising Trading Volume: A 23% increase in trading volume over the week points to growing market interest in INJ.
- Market Position: With a market cap ranking of #35 and a $4.33 billion valuation, INJ remains a significant cryptocurrency.
Disclaimer: The information provided here is for informational purposes only and should not be considered financial or trading advice. Cryptocurrency investments are inherently risky. Bitcoinworld.co.in is not responsible for any investment decisions made based on this information. Always conduct thorough independent research and consider consulting with a financial advisor before investing in cryptocurrencies.
#Binance #WRITE2EARN
Disclaimer: The information provided is not trading advice, Bitcoinworld.co.in holds no liability for any investments made based on the information provided on this page. We strongly recommend independent research and/or consultation with a qualified professional before making any investment decisions.