
Solana (SOL) is making waves in the crypto market! After a period of consolidation, SOL has surged over 10%, breaking above key resistance levels and hinting at a potential bullish rally. Is this the start of a significant uptrend, or will it face another correction? Let’s dive into the technical analysis to uncover what’s next for Solana.
Solana’s Bullish Momentum: What’s Driving the Surge?
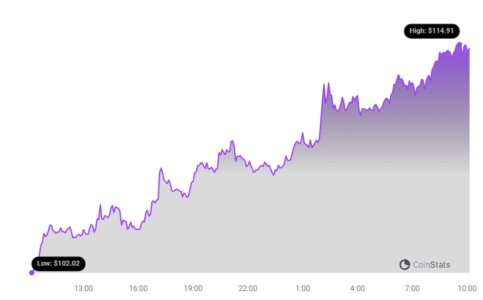
Solana’s recent price action demonstrates strong bullish momentum. After finding support around $93.50, SOL initiated a fresh rally, surpassing the $100 resistance level. Key factors contributing to this surge include:
- Breakout Above Key Resistance: SOL successfully broke above a crucial contracting triangle with resistance near $104, signaling a shift in market sentiment.
- Outperforming Major Cryptocurrencies: SOL’s impressive 10% gain surpasses the performance of both Bitcoin and Ethereum, attracting increased investor attention.
- Technical Indicators Aligning: Trading above the 100 simple moving average (4 hours) suggests a positive short-term trend.
Key Resistance Levels to Watch
As Solana continues its upward trajectory, identifying key resistance levels is crucial for understanding potential price targets and areas of consolidation. Here are the immediate resistance levels to watch:
- $114: This is the immediate resistance level that SOL is currently testing. A successful break above this level would further confirm the bullish momentum.
- $118: Representing the 76.4% Fib retracement level of the recent downward move, this is a significant resistance point. Overcoming this hurdle could trigger a more substantial rally.
- $125: A decisive close above $125 could pave the way for another major rally, potentially targeting higher price levels.
- $138: Beyond $125, $138 serves as the next key resistance level.
- $145: A move beyond $138 could propel SOL towards the $145 level.
Could Solana Face a Downside Correction?
While the current trend appears bullish, it’s essential to consider the possibility of a downside correction. Here are the key support levels to monitor in case of a pullback:
- $108: This level provides initial support. A break below this point could indicate weakening bullish momentum.
- $100: Coinciding with the 100 simple moving average (4 hours), this is a crucial support level.
- $94: A close below $94 could lead to a more significant decline towards the $80 support level.
Technical Indicators: A Closer Look
Analyzing technical indicators provides further insights into Solana’s price action:
- 4-Hours MACD: The MACD is gaining pace in the bullish zone, suggesting continued upward momentum.
- 4-Hours RSI: The RSI is above the 50 level, indicating a positive trend but not yet overbought conditions.
Solana (SOL) Price Prediction: What’s Next?
Based on the current technical analysis, Solana appears poised for further gains, provided it can successfully break above the $118 resistance level. However, traders should remain vigilant and monitor key support levels in case of a potential downside correction.
Key Takeaways:
- Solana has demonstrated strong bullish momentum, breaking above key resistance levels.
- The next major resistance level to watch is $118.
- Potential downside correction could find support at $108, $100, and $94.
- Technical indicators suggest continued upward momentum.
Disclaimer: This analysis is for informational purposes only and does not constitute financial advice. Cryptocurrency investments are inherently risky, and you should conduct thorough research and consult with a qualified financial advisor before making any investment decisions.
Disclaimer: The information provided is not trading advice, Bitcoinworld.co.in holds no liability for any investments made based on the information provided on this page. We strongly recommend independent research and/or consultation with a qualified professional before making any investment decisions.