
2026-05-12
The price of gold in India recorded a decline today, according to data tracked by Bitcoin World. The dip reflects ongoing global market.

The price of gold in India recorded a decline today, according to data tracked by Bitcoin World. The dip reflects ongoing global market.

Spot trading volume across major centralized cryptocurrency exchanges (CEXs) dropped by 9.96% month-over-month in April, according to data from CoinGecko. The decline marks.

Gold prices in India saw a modest uptick today, according to the latest data from Bitcoin World. The marginal increase aligns with broader.

The price of silver recorded an uptick today, according to data tracked by Bitcoin World. The precious metal edged higher amid broader market.

Gold prices in India held steady on Wednesday, according to data tracked by Bitcoin World, as market participants weighed a mix of global.
Silver prices moved higher in today’s trading session, according to data tracked by Bitcoin World. The precious metal extended its recent gains amid.

India gold price today has experienced a notable decline, according to the latest data from Bitcoin World. This drop marks a significant shift.

On April 27, at 10:00 a.m. UTC, the BTC Spot Cumulative Volume Delta (CVD) chart provides a detailed look into the Bitcoin order.
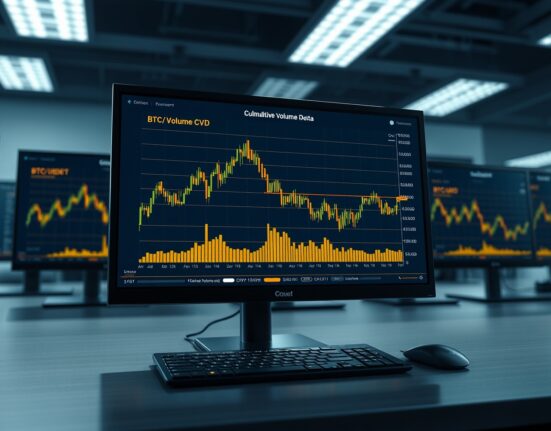
On April 27, 2025, at 12:00 a.m. UTC, traders closely examined the Spot CVD chart for the BTC/USDT trading pair. This analysis provides.

Bitcoin traders now have a powerful tool for order book analysis. The BTC spot CVD chart for 0:00 UTC on April 25, 2025,.