
2026-07-02
The GBP/JPY currency pair has broken out of its recent trading range, with bullish momentum pushing prices toward the 216.00 level. The Relative.

The GBP/JPY currency pair has broken out of its recent trading range, with bullish momentum pushing prices toward the 216.00 level. The Relative.

Silver prices continue to face downward pressure, with XAG/USD trading below the $60 mark as the Relative Strength Index (RSI) remains entrenched in.

The New Zealand dollar continues to face significant selling pressure against its US counterpart, with the NZD/USD pair hovering near seven-month lows. The.
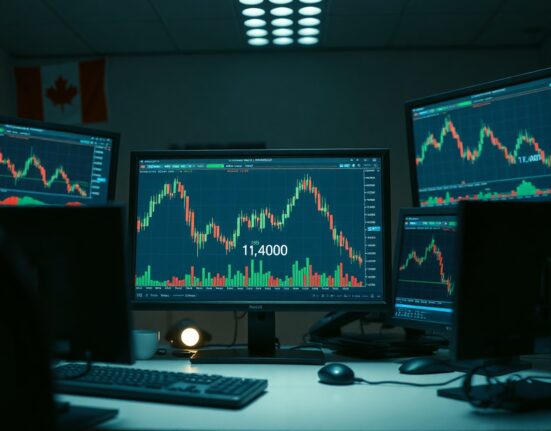
The USD/CAD currency pair continues to trade above the psychologically significant 1.4000 level, maintaining a strong bullish bias even as technical indicators flash.

The USD/CAD currency pair is facing renewed selling pressure near the psychologically significant 1.4000 level, as technical indicators flash early warning signals. The.

West Texas Intermediate (WTI) crude oil prices are showing renewed technical weakness as the Relative Strength Index (RSI) points lower while the commodity.

The EUR/USD currency pair has edged higher, approaching the 1.1600 psychological resistance level, yet technical indicators suggest the bullish momentum may be fragile..
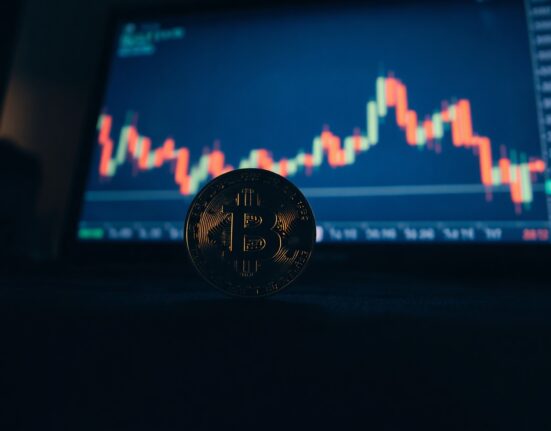
Bitcoin’s recent price action is offering a subtle signal that the intense selling pressure may be easing, according to a new technical analysis.

As Bitcoin faces renewed short-term selling pressure, a widely followed crypto analyst is pointing to on-chain metrics that historically precede price recoveries. Michaël.
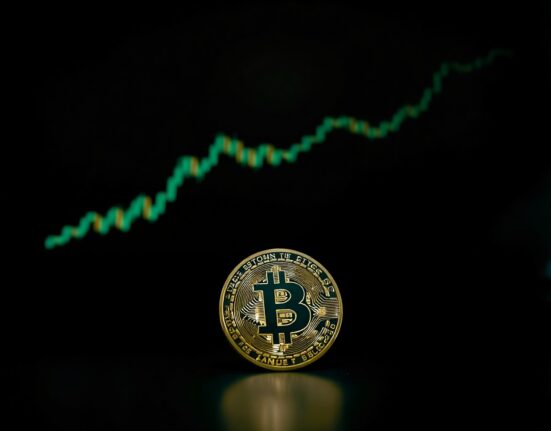
Bitcoin is flashing a technical signal on its weekly chart that traders last saw during the aftermath of the FTX collapse in November.