

2026-08-29
The S&P 500 is facing a bearish September setup as seasonal weakness aligns with a technical pattern suggesting a possible five-wave decline toward.
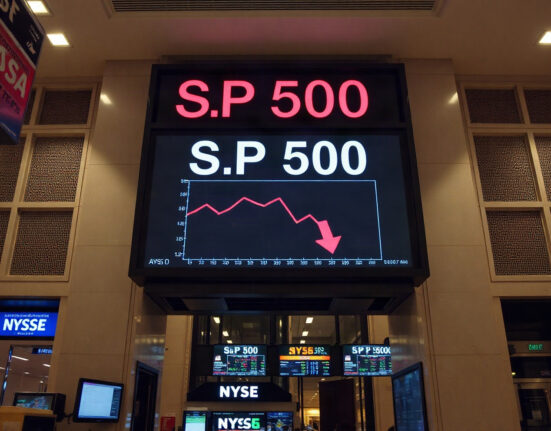
The S&P 500 is facing a bearish September setup as seasonal weakness aligns with a technical pattern suggesting a possible five-wave decline toward.

U.S. stocks closed lower on [insert date], with the three major indices ending the session in negative territory. The S&P 500 fell 0.25%,.
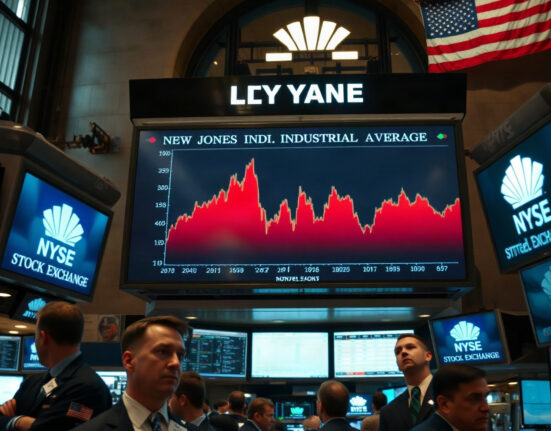
The Dow Jones Industrial Average gave up its earlier gains on Wednesday, closing flat after the Federal Reserve held interest rates steady and.

U.S. equities began the trading session on a mixed note, with the S&P 500 and the Dow Jones Industrial Average edging higher while.

The S&P 500 is trading near a critical resistance level as investors turn their attention to a scheduled speech by Federal Reserve Governor.

Major U.S. stock indexes edged higher in early trading on February 12, 2026, even as the broader market faced downward pressure, with investors.

In 2026, mastering key stock chart patterns remains a cornerstone of technical analysis, offering traders a structured way to anticipate market moves. Whether.

As investors gather for the Jackson Hole Economic Symposium, the market’s attention has shifted from the Federal Reserve’s interest rate path to Nvidia’s.

Elliott Wave analysis suggests that the SPDR S&P 500 ETF (SPY) is finalizing its current impulsive leg, setting the stage for a larger-cycle.

Goldman Sachs (GS) stock is currently holding above a critical 0.5 support arc, a technical pattern that traders are watching closely for a.