

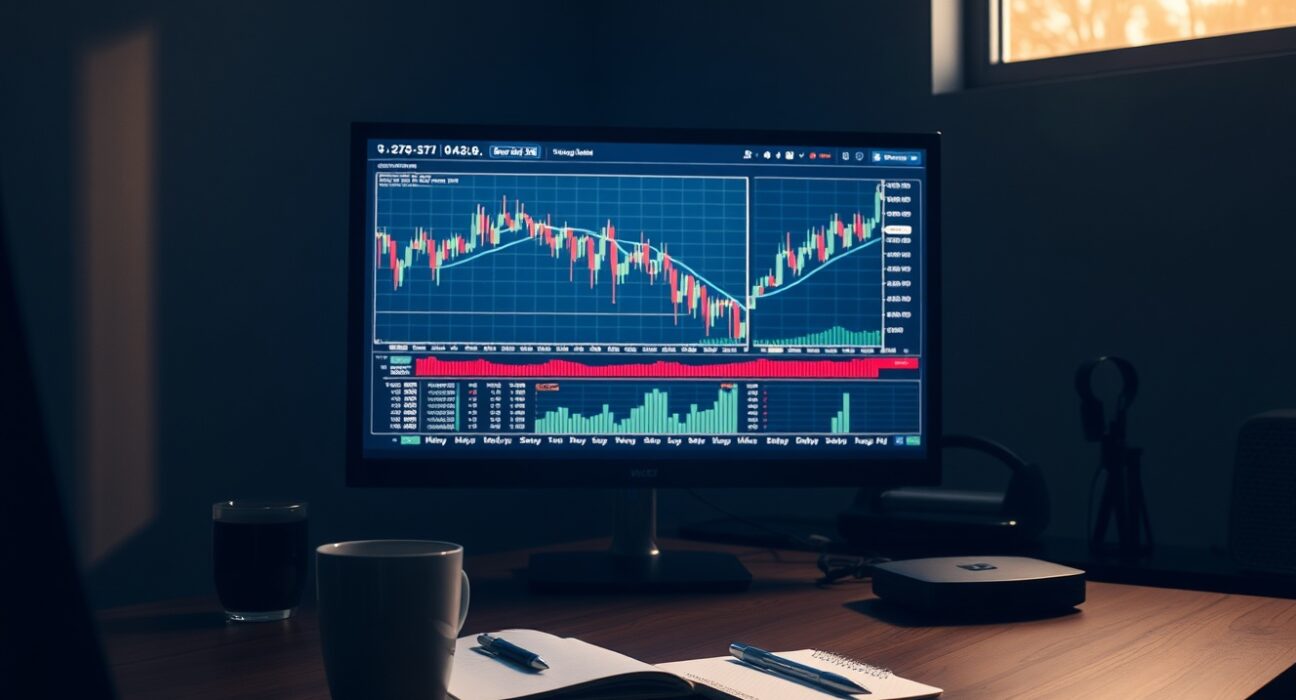
Technical analysis remains a cornerstone of trading in 2026, with traders relying on chart patterns, indicators, and price action to navigate increasingly complex markets. As of this year, the practice has evolved beyond simple trend lines, integrating algorithmic tools and behavioral finance to better interpret market sentiment. This guide provides a comprehensive overview of the core principles, tools, and strategies that define technical analysis today, offering both novice and experienced traders a structured approach to reading the markets.
What Is Technical Analysis and Why Does It Matter?
Technical analysis is the study of historical price and volume data to forecast future market movements, based on the idea that all known information is already reflected in an asset’s price. Unlike fundamental analysis, which evaluates a company’s financial health or an asset’s intrinsic value, technical analysis focuses purely on market activity. In 2026, its relevance has grown as retail and institutional traders alike use charting platforms to identify entry and exit points, manage risk, and gauge market psychology. The method is particularly valuable in volatile markets, where price patterns often repeat due to collective trader behavior.
Core Tools and Chart Patterns in 2026
Traders in 2026 have access to an array of technical tools, but the fundamentals remain unchanged. Candlestick charts are the primary visual medium, offering a clear view of price action within a set period. Key patterns such as head-and-shoulders, double tops and bottoms, and triangles continue to signal potential reversals or continuations. Support and resistance levels, drawn from historical price points, remain essential for identifying where supply and demand might shift. Additionally, moving averages—such as the 50-day and 200-day—help smooth out price data to reveal trends, while the Relative Strength Index (RSI) and Moving Average Convergence Divergence (MACD) provide momentum and trend strength insights.
Integrating Indicators with Price Action
Successful traders in 2026 do not rely on a single indicator. Instead, they combine multiple tools to confirm signals. For example, a breakout above a resistance level on high volume, accompanied by a rising RSI, may be seen as a stronger buy signal than a breakout on low volume. This confluence approach reduces false signals and enhances decision-making. Moreover, the rise of algorithmic trading has led to the development of custom indicators that can be backtested on historical data, allowing traders to refine their strategies with greater precision.
Risk Management and the Role of Psychology
Technical analysis is not just about identifying opportunities; it is equally about managing risk. Setting stop-loss orders based on technical levels—such as below a support level—helps traders limit losses if the market moves against them. Position sizing, based on the distance to the stop and account size, is another critical component. In 2026, traders are also more aware of the psychological aspects of trading, such as fear and greed, which can lead to impulsive decisions. A disciplined approach, grounded in a well-defined trading plan, is essential to avoid emotional reactions to market swings.
Why This Matters for Traders
Understanding technical analysis is vital for anyone participating in financial markets, whether trading stocks, forex, or cryptocurrencies. It provides a structured framework for interpreting price movements, making informed decisions, and managing risk. In a year marked by economic uncertainty and rapid technological change, the ability to read charts and adapt to market conditions is a valuable skill. Moreover, as markets become more efficient, the combination of technical analysis with a solid understanding of market fundamentals can give traders a competitive edge.
Conclusion
Technical analysis in 2026 is a dynamic and essential discipline for traders. By mastering chart patterns, indicators, and risk management, traders can navigate markets with greater confidence and precision. While no method guarantees success, the principles outlined in this guide offer a solid foundation for building a robust trading strategy. As always, staying informed and continuously learning are key to adapting to evolving market conditions.
FAQs
Q1: What is the most reliable technical indicator?
No single indicator is foolproof; reliability depends on market conditions and the timeframe. Combining indicators, such as moving averages and RSI, often yields more consistent results than relying on one alone.
Q2: Can technical analysis be used for long-term investing?
Yes, technical analysis can be applied to longer timeframes, such as weekly or monthly charts, to identify major trends and potential entry points. Many long-term investors use it to time their purchases or sales.
Q3: Do I need expensive software to perform technical analysis?
No, many free platforms offer comprehensive charting tools, including candlestick charts, indicators, and drawing tools. Paid platforms may offer advanced features, but they are not essential for beginners.
Disclaimer: The information provided is not trading advice, Bitcoinworld.co.in holds no liability for any investments made based on the information provided on this page. We strongly recommend independent research and/or consultation with a qualified professional before making any investment decisions.
