Toncoin (TON) has been making waves in the crypto market recently, with a noticeable surge that has caught the attention of traders and investors alike. After a period of consolidation, TON bulls have stepped back into the arena, pushing the price above key moving averages. This begs the question on everyone’s mind: Is this the moment for TON buyers to finally go long, or are there hidden signals suggesting a potential downturn? Let’s dive deep into the charts and indicators to decipher what’s really happening with Toncoin.
TON’s Bullish Momentum: A Green Light for Buyers?
Recently, Toncoin experienced a significant upswing, breaking above both its 20-day and 50-day Exponential Moving Averages (EMAs). This move is often seen as a bullish signal, indicating renewed buying interest in the asset. The price reversal from the $6.9 support level further strengthens this bullish narrative, showcasing the resilience of buyers in defending key price points. Take a look at the recent price action:
- **Bullish Breakout:** TON decisively moved above its short-term (20-day) and medium-term (50-day) EMAs.
- **Support Confirmation:** The price bounced back strongly from the $6.9 support level, indicating strong demand at this level.
- **Green Candles Galore:** A series of green candles on the chart visually confirms the buying pressure dominating the market.
However, the path ahead might not be entirely clear. Sellers could still pose a challenge, particularly around the $7.7 resistance level. If sellers regain control and defend this resistance, we might see a near-term pullback towards areas of higher liquidity. As of now, TON is trading near $7. So, what does the bigger picture reveal?
Ascending Channel Formation: Riding the Uptrend?
Zooming out to a broader timeframe, we can observe that TON’s bullish journey started about two months ago, after rebounding from the $4.8 support level. Since then, TON has been on a remarkable uptrend, delivering impressive gains of nearly 70% in under two months! This surge culminated in a new All-Time High (ATH) of $8.24 on June 15th.
Throughout this rally, the 20-day and 50-day EMAs have acted as robust support levels, consistently underpinning TON’s upward trajectory. Interestingly, this entire price action has carved out a classic ascending channel pattern on the daily chart. Let’s break down what this means:
- **Steep Uptrend:** A significant 70% gain in less than two months highlights the strong bullish momentum.
- **EMA Support:** Consistent support from the 20-day and 50-day EMAs confirms the strength of the uptrend.
- **Ascending Channel:** The price action has formed a well-defined ascending channel, a pattern often associated with continued bullishness.
Currently, the price action is navigating a zone of high liquidity, suggesting a potential period of consolidation or a decisive move. A break and close above the middle line of this ascending channel could signal a continuation of the bullish trend, potentially pushing TON towards the $8.2-$8.5 range, aiming to retest or even surpass the recent ATH.
Conversely, a break below the ascending channel could pave the way for a potential downside correction in the coming weeks, with sellers likely targeting the $6 level as the next significant support.
RSI and OBV: Are There Hidden Bearish Signals?
The Relative Strength Index (RSI) currently resides in the bullish territory, which is generally a positive sign. However, it’s showing signs of easing buying pressure. A drop below the midline on the RSI could indicate a growing bearish influence.
Furthermore, the On Balance Volume (OBV) presents a more concerning picture. While the price has climbed over the past ten days, the OBV has shown a flat or even slightly declining trend. This divergence between price and volume is a classic bearish divergence. What does this divergence tell us?
- **RSI in Bullish Zone:** Positive momentum indicated by RSI above 50.
- **Easing RSI:** Slight decrease in RSI suggests potential weakening bullish momentum.
- **Bearish OBV Divergence:** Flat or declining OBV despite price increase points to weakening buying volume and potential trend reversal.
This bearish divergence on the OBV hints that the current uptrend might be losing steam and could be ripe for a reversal or a phase of consolidation. Traders should be wary of this potential warning sign.
Funding Rates: A Seller’s Market?
Lastly, let’s consider the funding rates. An analysis of TON’s funding rates across various exchanges reveals a consistently negative reading. Negative funding rates typically indicate that short positions are paying long positions, suggesting a bearish sentiment prevailing in the derivatives market.
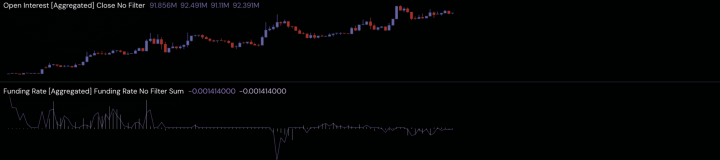
Adding to this, predictive funding rates also lean towards the negative side, further reinforcing a slightly bearish outlook based on funding rate analysis.
So, what’s the takeaway from these funding rates?
- **Negative Funding Rates:** Indicates bearish sentiment in the perpetual futures market.
- **Predictive Funding Rates Negative:** Reinforces the short-term bearish outlook based on funding.
Navigating TON’s Price Action: Proceed with Caution?
In conclusion, while Toncoin has demonstrated strong bullish momentum recently, propelling its price above key EMAs and forming an ascending channel, there are also cautionary signals emerging from technical indicators and funding rates. The bearish divergence on the OBV and consistently negative funding rates suggest that the current uptrend might be facing headwinds and could be vulnerable to a reversal or consolidation.
For TON buyers, while the initial breakout looks promising, it might be prudent to exercise caution. The conflicting signals suggest that waiting for further confirmation could be a wise strategy. Keep a close eye on the $7.7 resistance and the ascending channel’s middle line for potential breakout signals. Conversely, monitor for a break below the ascending channel and RSI midline for potential downside risks.
The OBV divergence and negative funding rates serve as early warning signs. Therefore, before jumping into new long positions or holding existing ones, seeking more confirmation through price action and further indicator analysis would be a prudent approach to navigating TON’s current market dynamics. Stay informed, trade wisely!
Disclaimer: The information provided is not trading advice, Bitcoinworld.co.in holds no liability for any investments made based on the information provided on this page. We strongly recommend independent research and/or consultation with a qualified professional before making any investment decisions.