

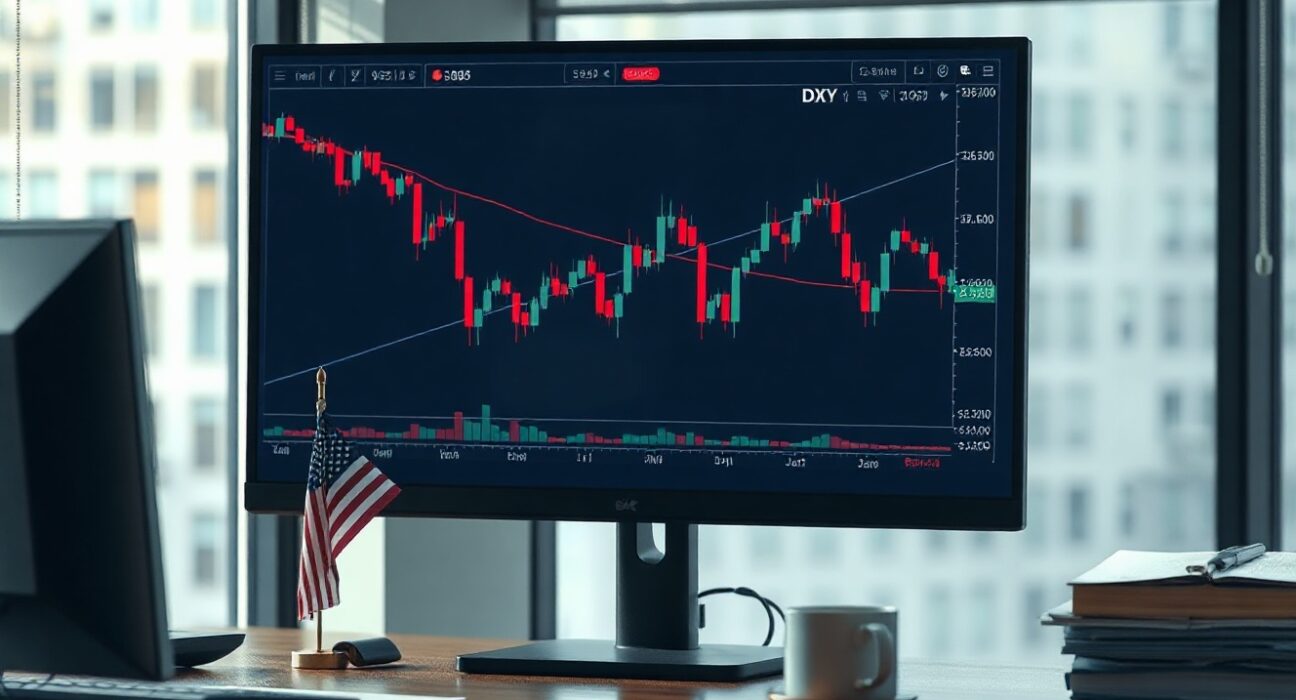
The US Dollar Index (DXY) fell to the 99.75-99.70 range during Thursday trading, pressured by diminishing expectations that the Federal Reserve will implement further interest rate hikes. The move reflects a broader shift in market sentiment as investors recalibrate their outlook on US monetary policy amid mixed economic data and easing inflation pressures.
What’s Driving the Dollar’s Decline?
The primary catalyst behind the dollar’s slide is the growing conviction among traders that the Fed’s tightening cycle has peaked. Recent inflation reports have shown a steady cooling, while labor market indicators have begun to soften, prompting markets to price in a higher probability of rate cuts later this year. According to CME Group’s FedWatch tool, the probability of a 25-basis-point hike at the next FOMC meeting has fallen below 10%, down from over 30% a month ago.
Additionally, comments from several Fed officials have adopted a more cautious tone, emphasizing data-dependence and the need to avoid over-tightening. This contrasts with the hawkish stance that dominated earlier in the year, further undermining dollar strength. The index, which measures the greenback against a basket of six major currencies, has now retreated from its recent highs near 101.00, a level not seen since early March.
Technical Outlook for DXY
From a technical perspective, the dollar index is testing a critical support zone at 99.75-99.70, which aligns with the 200-day moving average. A decisive break below this level could open the door to further downside, with the next support seen around 99.20, followed by the 98.80 area. Conversely, a rebound from this zone may signal a short-term bounce, but resistance is now established at 100.30 and then 100.80.
Momentum indicators are turning bearish, with the Relative Strength Index (RSI) slipping below 50, suggesting that sellers are gaining control. The Moving Average Convergence Divergence (MACD) has also generated a bearish crossover, reinforcing the negative outlook. However, traders should remain cautious, as the dollar remains sensitive to upcoming economic data releases, particularly the next non-farm payrolls report and the Fed’s preferred inflation gauge, the core PCE price index.
Implications for Global Markets
The dollar’s weakness has broad implications for global financial markets. A softer dollar tends to support commodity prices, as they are priced in the greenback, and can ease financial conditions for emerging market economies that hold dollar-denominated debt. It also provides a tailwind for multinational companies based in the US, as a weaker dollar boosts the value of overseas revenues when converted back to USD.
For currency traders, the focus now shifts to the European Central Bank and the Bank of Japan, whose policy stances will influence the dollar’s trajectory. The euro has already strengthened against the dollar, trading near 1.0950, while the yen has also gained ground, with USD/JPY slipping below 138.00.
Conclusion
The US Dollar Index’s decline to 99.75-99.70 underscores a significant shift in market expectations regarding Federal Reserve policy. With rate hike bets receding, the dollar faces renewed downside pressure, though key support levels may offer temporary stability. Traders will closely monitor upcoming economic data and central bank communications for further direction.
FAQs
Q1: What is the US Dollar Index (DXY)?
The US Dollar Index measures the value of the US dollar against a basket of six major currencies: the euro, Japanese yen, British pound, Canadian dollar, Swedish krona, and Swiss franc. It is a widely used benchmark for the dollar’s overall strength in global markets.
Q2: Why are Fed rate hike bets affecting the dollar?
Higher interest rates typically attract foreign investment, increasing demand for the dollar. When expectations of rate hikes fade, the dollar tends to weaken as investors seek higher yields elsewhere.
Q3: What are the key support levels for DXY?
Immediate support is at 99.75-99.70, followed by 99.20 and 98.80. A break below these levels could signal further downside, while resistance is seen at 100.30 and 100.80.
Disclaimer: The information provided is not trading advice, Bitcoinworld.co.in holds no liability for any investments made based on the information provided on this page. We strongly recommend independent research and/or consultation with a qualified professional before making any investment decisions.
