
LONDON, March 2025 – The U.S. dollar maintains crucial range support levels despite escalating geopolitical tensions, according to recent technical analysis from ING. Market participants closely monitor these developments as currency stability faces persistent pressure from ongoing conflicts.
USD Range Support Analysis and Technical Framework
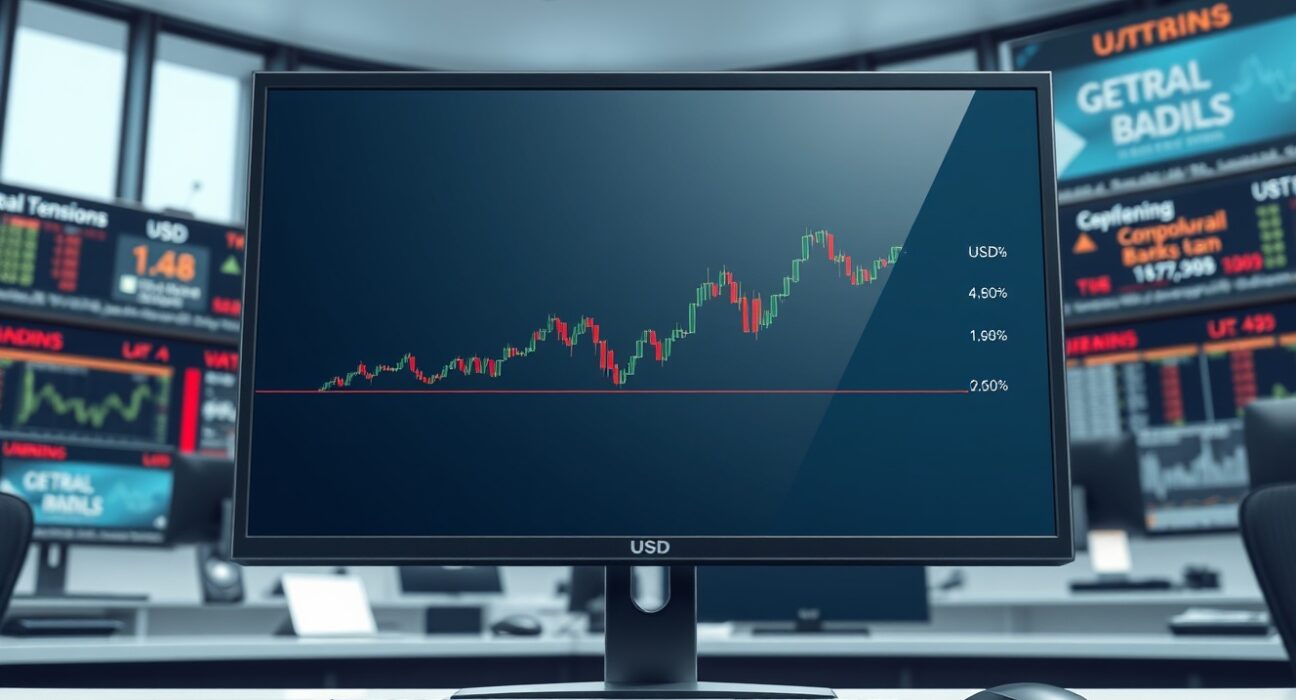
ING’s technical analysis reveals significant support zones for the U.S. dollar index. These levels demonstrate remarkable resilience amid market volatility. The dollar index currently tests established support between 103.50 and 103.80. This range has held firm through multiple geopolitical events.
Technical indicators provide crucial context for current market conditions. The Relative Strength Index (RSI) shows neutral positioning around 45. Moving averages converge near current price levels. Additionally, trading volumes remain consistent with historical patterns. Market structure suggests institutional support at these technical levels.
Historical data reveals important patterns in dollar behavior. Previous geopolitical events created similar technical setups. The 2022 conflict period established comparable support zones. Market memory appears to influence current price action significantly. Technical analysts observe repeating patterns in crisis conditions.
Geopolitical Context and Market Impacts
Persistent conflict creates complex market dynamics. Currency markets respond to multiple geopolitical factors simultaneously. Regional tensions affect global trade flows substantially. Energy markets influence dollar strength through various channels. Central bank policies adapt to changing conflict conditions.
Recent developments demonstrate specific market impacts. Energy price volatility affects currency correlations directly. Safe-haven flows show predictable patterns during crises. Trade disruptions create currency supply imbalances. Capital movements follow established risk-aversion pathways.
Global economic relationships experience significant strain. Trading partnerships face unprecedented challenges. Supply chain disruptions affect currency valuations. International payment systems encounter operational difficulties. Financial sanctions create complex currency dynamics.
Expert Analysis from ING’s Research Team
ING’s currency strategists provide detailed technical perspectives. Their analysis combines multiple methodological approaches. Quantitative models incorporate geopolitical risk factors. Historical comparisons offer valuable context for current conditions. Technical indicators receive careful interpretation.
The research team identifies several critical factors. Support levels demonstrate institutional buying interest. Trading ranges reflect market uncertainty accurately. Technical patterns suggest potential breakout scenarios. Volume analysis confirms genuine support at key levels.
Market psychology plays a crucial role currently. Trader positioning shows defensive characteristics. Risk management strategies adapt to conflict conditions. Institutional flows follow established technical levels. Market sentiment reflects geopolitical developments accurately.
Technical Indicators and Market Signals
Multiple technical tools provide market insights. Moving averages show specific convergence patterns. Support and resistance levels demonstrate historical significance. Chart patterns reveal important market structure information.
Key technical observations include:
- Support Zone Integrity: The 103.50-103.80 range shows consistent buying interest
- Volume Confirmation: Trading volumes validate support level significance
- Indicator Alignment: Multiple technical tools converge at current levels
- Pattern Recognition: Historical patterns repeat in current market conditions
Market participants monitor specific technical developments. Breakout scenarios receive careful consideration. Support level breaches would signal significant market changes. Range-bound trading suggests ongoing uncertainty. Technical analysis provides crucial risk management tools.
Comparative Analysis and Historical Context
Historical comparisons offer valuable market insights. Previous conflict periods show similar technical characteristics. Market responses follow established patterns during crises. Technical levels demonstrate remarkable consistency across events.
| Conflict Period | USD Support Level | Duration | Market Outcome |
|---|---|---|---|
| 2022 Regional Conflict | 103.20-103.60 | 8 weeks | Range-bound then breakout |
| 2020 Pandemic Crisis | 102.80-103.40 | 12 weeks | Sustained range trading |
| 2019 Trade Tensions | 103.60-104.20 | 10 weeks | Gradual appreciation |
Market structure shows important evolutionary patterns. Trading ranges adapt to changing market conditions. Support levels demonstrate increasing sophistication over time. Technical analysis incorporates more complex geopolitical factors.
Market Implications and Future Scenarios
Current technical conditions suggest specific market implications. Range-bound trading may continue during conflict persistence. Support levels provide crucial risk management reference points. Breakout scenarios require careful monitoring and preparation.
Market participants face several potential scenarios. Support level maintenance suggests continued range trading. Technical breakdowns would signal significant market shifts. Geopolitical developments remain the primary market driver. Technical analysis provides framework for scenario planning.
Risk management strategies adapt to current conditions. Position sizing reflects market uncertainty appropriately. Stop-loss placement considers technical support levels. Portfolio diversification addresses geopolitical risks effectively.
Conclusion
The U.S. dollar demonstrates remarkable technical resilience as USD range support holds firm amid persistent geopolitical conflict. ING’s analysis reveals crucial support levels between 103.50 and 103.80 that continue to withstand market pressures. Technical indicators, historical patterns, and expert analysis combine to provide comprehensive market understanding. Market participants must monitor these developments closely while maintaining disciplined risk management approaches during ongoing uncertainty.
FAQs
Q1: What does USD range support refer to in technical analysis?
USD range support refers to specific price levels where buying interest consistently prevents further decline in the U.S. dollar index. These levels represent areas where market participants historically demonstrate strong demand, creating technical floors that influence trading decisions and risk management strategies.
Q2: How does geopolitical conflict affect currency market technical analysis?
Geopolitical conflict introduces volatility that tests established technical levels while creating new patterns. Technical analysts must adapt their frameworks to incorporate conflict-driven market psychology, altered trading volumes, and shifting support/resistance levels that reflect changing risk perceptions and capital flows.
Q3: What technical indicators are most relevant for analyzing USD during conflicts?
Key indicators include support/resistance levels, moving averages, Relative Strength Index (RSI), trading volumes, and chart patterns. During conflicts, analysts particularly focus on support level integrity, volume confirmation at key levels, and the convergence of multiple indicators that validate technical signals.
Q4: How reliable is technical analysis during periods of geopolitical uncertainty?
Technical analysis remains valuable during uncertainty but requires careful interpretation. While historical patterns and established levels provide frameworks, analysts must account for unprecedented events and rapidly changing conditions. Technical analysis works best when combined with fundamental and geopolitical analysis during conflict periods.
Q5: What happens if USD breaks below current range support levels?
A breakdown below current USD range support would signal significant market shifts, potentially indicating increased risk aversion, changing central bank policies, or escalating conflict impacts. Such breaks typically trigger increased volatility, revised technical targets, and adjustments to trading strategies across currency markets.
Disclaimer: The information provided is not trading advice, Bitcoinworld.co.in holds no liability for any investments made based on the information provided on this page. We strongly recommend independent research and/or consultation with a qualified professional before making any investment decisions.