

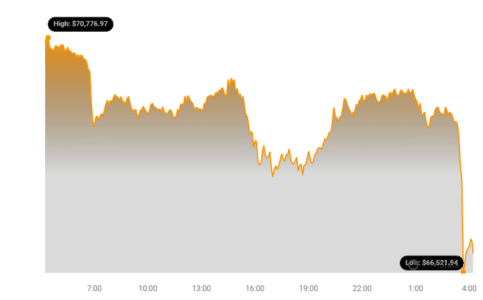
Bitcoin (BTC) has experienced another downturn, retreating from the $70,000 resistance level to $66,000 as bearish forces gained momentum. This represents a drop of over 5%, breaching the $67,000 support. What’s next for Bitcoin? Let’s delve into the critical support and resistance levels that will dictate its trajectory.
Bitcoin Price Turns Red: What Happened?
Bitcoin struggled to maintain its position above the $70,000 resistance zone, leading to a downside reaction after breaking through the $69,200 support. The price experienced a sharp decline, falling below $68,500 and eventually testing the $66,000 level with a bearish inclination.
Here’s a breakdown of the key movements:
- Initial Struggle: Failed to settle above $70,000.
- Breached Support: Broke the $69,200 support zone.
- Sharp Decline: Fell below $68,500.
- Tested $66,000: Reached a low near $65,992.
- Recovery Attempt: Initiated a recovery wave, moving above $66,800.
A low was established near $65,992, and Bitcoin is currently attempting a recovery. The price has moved above the 23.6% Fib retracement level from the $69,884 swing high to the $65,992 low.
However, Bitcoin is trading below $68,500 and the 100-hour Simple Moving Average (SMA). A crucial bearish trend line is forming with resistance near $68,400 on the hourly chart for BTC/USD.
See Also: Bitcoin (BTC) Becomes More Volatile Than Ether As Halving Approaches
Immediate resistance lies near the $68,000 level, coinciding with the 50% Fib retracement level of the recent downward move. The first major resistance is at $68,500, aligning with the trend line. A clear move above this zone could signal a fresh increase, potentially driving the price toward the $70,000 resistance zone. The next significant resistance is near $71,500.
Could BTC Face Further Losses?
If Bitcoin fails to overcome the $67,000 resistance, a continued downward trajectory is possible. Immediate support rests near $66,000.
The primary support level is at $65,000, followed by $64,000. A close below $64,000 could trigger a drop toward $62,500, with further losses potentially leading to the $60,500 support zone in the near future.
Key Technical Indicators to Watch
- Hourly MACD: Gaining pace in the bearish zone.
- Hourly RSI (Relative Strength Index): Below the 50 level, indicating bearish momentum.
- Major Support Levels: $66,000, followed by $65,000.
- Major Resistance Levels: $68,000, $68,500, and $70,000.
In Summary
Bitcoin’s recent price action indicates a struggle between bulls and bears. The failure to sustain above $70,000 has led to a decline, with key support levels being tested. Monitoring the $66,000 and $64,000 support levels, as well as the $68,000 and $68,500 resistance levels, will be crucial in determining Bitcoin’s next move. Keep an eye on the technical indicators for further insights into market sentiment and potential trend reversals.
Disclaimer: The information provided is not trading advice. Bitcoinworld.co.in holds no liability for any investments made based on the information provided on this page. We strongly recommend independent research and/or consultation with a qualified professional before making any investment decisions.
#Binance #WRITE2EARN
Disclaimer: The information provided is not trading advice, Bitcoinworld.co.in holds no liability for any investments made based on the information provided on this page. We strongly recommend independent research and/or consultation with a qualified professional before making any investment decisions.