
Bitcoin (BTC) price started another decline from the $70,000 resistance zone to $66k as bears gained strength. BTC is down over 5% and there was a move below the $67,000 support.
Bitcoin Price Turns Red
Bitcoin price struggled to settle above the $70,000 resistance zone. BTC reacted to the downside after it broke the $69,200 support zone.
There was a sharp move below the $68,500 level.
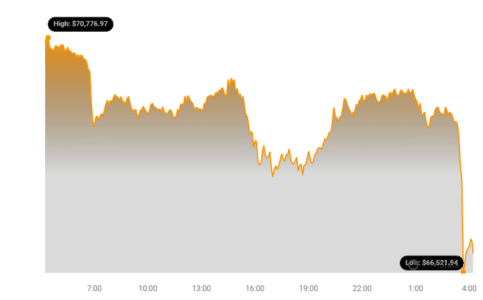
The price even declined below the $67,000 level. Finally, it tested the $66,000 with a bearish angle.
A low was formed near $65,992 and the price is now attempting a recovery wave. There was a move above the $66,800 level.
The price moved above the 23.6% Fib retracement level of the downward move from the $69,884 swing high to the $65,992 low.
However, Bitcoin is now trading below $68,500 and the 100 hourly Simple moving average. There is also a key bearish trend line forming with resistance near $68,400 on the hourly chart of the BTC/USD.
See Also: Bitcoin (BTC) Becomes More Volatile Than Ether As Halving Approaches
Immediate resistance is near the $68,000 level. It is close to the 50% Fib retracement level of the downward move from the $69,884 swing high to the $65,992 low.
The first major resistance could be $68,500 and the trend line. If there is a clear move above the $68,500 resistance zone, the price could start a fresh increase.
In the stated case, the price could rise toward the $70,000 resistance zone in the near term. The next major resistance is near the $71,500 zone.
More Losses In BTC?
If Bitcoin fails to rise above the $67,000 resistance zone, it could continue to move down. Immediate support on the downside is near the $66,000 level.
The first major support is $65,000. The next support sits at $64,000. If there is a close below $64,000, the price could start a drop toward the $62,500 level. Any more losses might send the price toward the $60,500 support zone in the near term.
Technical Indicators:
- Hourly MACD – The MACD is now gaining pace in the bearish zone.
- Hourly RSI (Relative Strength Index) – The RSI for BTC/USD is now below the 50 level.
- Major Support Levels – $66,000, followed by $65,000.
- Major Resistance Levels – $68,000, $68,500, and $70,000.
Disclaimer: The information provided is not trading advice. Bitcoinworld.co.in holds no liability for any investments made based on the information provided on this page. We strongly recommend independent research and/or consultation with a qualified professional before making any investment decisions.
#Binance #WRITE2EARN