
Exciting times in the crypto world! Ethereum (ETH), the second-largest cryptocurrency by market cap, has been showing some impressive bullish momentum lately. After navigating choppy waters, ETH has decisively broken above a crucial pivot point, sparking renewed interest and optimism among traders. Let’s dive deep into the recent price action and see what the charts are telling us about Ethereum’s potential trajectory.
Ethereum’s Breakout: What Happened Above $3,400?
For a while, the $3,400 level acted as a significant barrier for Ethereum. Think of it as a price ceiling that ETH was struggling to break through. However, recently, we witnessed a determined surge. Buyers stepped in aggressively, pushing the price above this hurdle. This breakout wasn’t just a minor blip; it signaled a shift in market sentiment, indicating that buyers were gaining control.
Crucially, ETH didn’t just briefly touch $3,400 and retreat. It established a solid base above the $3,450 zone. This base-building is a positive sign. It suggests that the upward movement is not just a fleeting pump but a more sustained uptrend. And indeed, the price action that followed confirmed this.
Surge Past $3,500 and Beyond: Hitting New Highs
Once Ethereum comfortably settled above $3,450, the bulls took charge. The price accelerated past the $3,500 mark, further fueled by crossing above the 100 hourly simple moving average (SMA). This SMA is a key indicator for traders, and moving above it often signals bullish momentum. The climb didn’t stop there! ETH powered through the $3,550 level and peaked at an impressive $3,580. This peak represents the highest point in this recent rally, showcasing the strength of the upward movement.
Currently, Ethereum is experiencing a bit of a pullback, a natural correction after such a strong surge. It’s like taking a breather before potentially making another run upwards. The price is currently consolidating around the $3,500 level. This consolidation phase is important to watch. Will it hold, or will we see further retracement?
To understand the extent of this correction, let’s look at Fibonacci retracement levels. This tool helps us identify potential support and resistance areas based on mathematical ratios. The 23.6% Fib retracement level of the recent upward swing (from $3,215 low to $3,580 high) comes in around $3,495. Encouragingly, Ethereum is currently holding above $3,480, suggesting that this retracement is so far relatively shallow and the bullish structure remains intact.
Key Levels to Watch: Support and Resistance
Technical analysis is all about identifying key levels that can act as potential turning points for price movements. Let’s break down the crucial support and resistance levels for Ethereum right now:
- Immediate Resistance: $3,525. This is the level ETH needs to overcome to resume its upward trajectory.
- Significant Resistance: $3,575. Breaking above this level would be a strong bullish signal, potentially opening the door for further gains.
- Immediate Support: $3,500. This level is currently acting as short-term support.
- Key Support Zone: $3,455 – $3,425. This zone is strengthened by the rising channel support and the 100 hourly SMA. A breakdown below this zone could signal a deeper correction.
- Critical Support: $3,400. This level is reinforced by the 50% Fib retracement and represents a significant psychological and technical support. Losing this level could lead to a more substantial downward move towards $3,220.
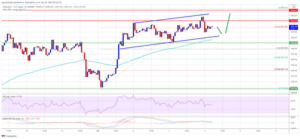
Source: ETHUSD on TradingView.com
Bullish Scenario: Targeting $3,600 and Beyond
If Ethereum can successfully break and hold above the $3,525 resistance, the bullish momentum is likely to accelerate. The next immediate target for the bulls would be the $3,575 resistance level. A decisive break above $3,575 could pave the way for a test of $3,600. Beyond $3,600, the next major upside target could be around $3,680. This bullish scenario hinges on continued positive market sentiment and buying pressure.
Bearish Scenario: Potential for a Deeper Correction?
Conversely, if Ethereum fails to overcome the $3,525 resistance, we might see a continuation of the current downward correction. The initial support to watch is $3,500. If this level breaks, the next key support zone lies between $3,455 and $3,425, as mentioned earlier. A breakdown below $3,400, especially the critical $3,400 support zone, would be a concerning signal for the bulls. It could indicate a deeper correction, potentially bringing the price down towards $3,220. Factors that could trigger a bearish scenario include negative news flow, broader crypto market weakness, or profit-taking after the recent rally.
Trading Insights and Actionable Takeaways
So, what does this analysis mean for traders? Here are some actionable insights:
- For Bullish Traders: Consider looking for potential long entry opportunities on a break above $3,525 or on a successful retest of the $3,500 support level. Place stop-loss orders below key support levels to manage risk. Targets could be $3,575, $3,600, and potentially $3,680 if momentum remains strong.
- For Bearish Traders: Look for potential short entry opportunities on a break below $3,500 or $3,455. Place stop-loss orders above resistance levels. Targets could be $3,400 and $3,220 in a more significant bearish move.
- Risk Management is Key: Regardless of your trading bias, always prioritize risk management. Use appropriate position sizing and stop-loss orders to protect your capital. The crypto market is volatile, and unexpected price swings can happen.
- Stay Informed: Keep an eye on broader market sentiment, Bitcoin’s price action (as it often influences altcoins), and any news or developments related to Ethereum and the crypto space.
Related Posts – XRP Price Goes Up After Unexpected Reappearance On Coinbase
The Bottom Line: Navigating Ethereum’s Price Swings
Ethereum has shown impressive resilience and bullish momentum, breaking above key resistance levels. While a short-term correction is underway, the overall bullish structure remains intact as long as key support levels hold. The coming days will be crucial in determining whether ETH can sustain its upward trajectory or if we will see a deeper pullback. Traders should closely monitor the key support and resistance levels outlined in this analysis and adapt their strategies accordingly. Remember, successful crypto trading requires a blend of technical analysis, risk management, and staying informed about market dynamics. Keep learning, stay vigilant, and happy trading!
Disclaimer: The information provided is not trading advice, Bitcoinworld.co.in holds no liability for any investments made based on the information provided on this page. We strongly recommend independent research and/or consultation with a qualified professional before making any investment decisions.