
Buckle up, crypto enthusiasts! The Ethereum market has been on a bit of a rollercoaster lately. After attempting to breach the $2,625 mark, ETH has taken a downward turn, leaving many traders wondering: what’s next for the second-largest cryptocurrency?
Ethereum’s Recent Price Action: A Deep Dive
Let’s break down the recent price movements of Ethereum to understand what’s been happening and what we can potentially expect. The bears seem to have taken control, pushing ETH below critical support levels. Here’s a quick recap:
- Downtrend Initiation: Ethereum started its recent downtrend from the $2,625 level, failing to sustain upward momentum.
- Breaching Support Levels: The price decisively broke below the $2,550 and $2,525 support levels, signaling increasing selling pressure.
- Sub-$2,500 Dip: ETH even dipped below the psychological $2,500 mark, settling below the 100-hour simple moving average – a key indicator for short-term trend analysis.
- Intraday Low: Ethereum touched a low of $2,486, triggering some alarm bells for bullish traders.
However, it’s not all doom and gloom! We’ve seen signs of a recent recovery, suggesting a potential battle between bulls and bears is underway.
The Bulls Fight Back: Is a Recovery Rally Brewing?
After hitting that low of $2,486, Ethereum showed resilience. Bulls stepped in, initiating a sharp recovery. Let’s examine the positive developments:
- Strong Rebound: Ethereum swiftly bounced back, breaking above the immediate resistance levels of $2,525 and $2,550.
- Fibonacci Retracement Level Breach: The price surged past the 50% Fibonacci retracement level of the recent drop (from $2,624 high to $2,486 low). This is a positive sign indicating potential trend reversal.
- Resistance at $2,580: Currently, Ethereum is facing resistance around the $2,580 level. Overcoming this resistance is crucial for further upward movement.
Key Resistance and Support Levels to Watch
Understanding key resistance and support levels is vital for navigating the Ethereum market. These levels can act as potential turning points for price action. Let’s identify the crucial zones:
Resistance Levels:
- Immediate Resistance: $2,580: As mentioned earlier, this is the immediate hurdle. A break above this level could fuel further gains.
- Significant Resistance 1: $2,625: This level marks the recent swing high and represents a strong resistance zone. Overcoming this is essential to negate the current downtrend.
- Major Resistance 2: $2,650: Beyond $2,625, the $2,650 level acts as the next significant resistance. A decisive close above this level could signal the start of a sustained upward rally, potentially targeting $2,750.
Support Levels:
- Initial Support: $2,550: This level, previously a resistance, now acts as initial support. Holding above this level is important to maintain the recovery momentum.
- Major Support 1: $2,500: The psychological $2,500 level is a critical support zone. A break below this could intensify selling pressure.
- Key Support 2: $2,480 – $2,420: The $2,480 level is the recent low. If breached, the $2,420 zone is the next significant support area where bulls might attempt to regain control. Failure to hold $2,420 could lead to further declines towards $2,350.
Hourly Chart Analysis: Trendline and Fibonacci Convergence
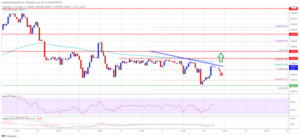
Zooming into the hourly chart (ETH/USD), we observe a crucial technical pattern forming:
- Negative Trendline Formation: A key negative trendline is developing with resistance near $2,580. This trendline is currently acting as a ceiling for price movements.
- Fibonacci Confluence: Interestingly, this trendline coincides with the 61.8% Fibonacci retracement level of the recent drop from $2,624 to $2,486. This convergence strengthens the resistance at the $2,580 zone.
This technical setup suggests that breaking above the $2,580 level will require significant bullish momentum. A successful breakout could invalidate the negative trendline and pave the way for further upside.
Ethereum Price Prediction: Bullish vs. Bearish Scenarios
Based on the current technical analysis, here are potential scenarios for Ethereum’s price movement:
Bullish Scenario:
- Break Above $2,625: If Ethereum can decisively break and hold above the $2,625 resistance, it would confirm a bullish reversal.
- Target $2,750 and Beyond: In a strong bullish scenario, ETH could target the $2,750 level and potentially aim for higher targets in the medium term.
- Factors Supporting Bullishness: Positive news flow, increased network activity on the Ethereum blockchain, and overall positive sentiment in the cryptocurrency market could fuel a bullish rally.
Bearish Scenario:
- Failure to Break $2,625: If Ethereum fails to overcome the $2,625 resistance and faces rejection at lower levels like $2,580, the downtrend could resume.
- Drop Below $2,500: A sustained break below the $2,500 support level would confirm bearish momentum and could trigger further selling.
- Potential Targets: $2,420 and $2,350: In a bearish scenario, ETH could retest the $2,420 support and potentially fall towards $2,350 if selling pressure intensifies.
- Factors Supporting Bearishness: Negative market news, regulatory uncertainties, and broader market corrections could contribute to a bearish outlook for Ethereum.
Navigating Ethereum Trading: Actionable Insights
For crypto traders navigating these uncertain times, here are some actionable insights:
- Monitor Key Levels: Closely watch the key resistance and support levels mentioned above. These levels can provide clues about potential price direction.
- Trendline Analysis: Pay attention to the negative trendline on the hourly chart. A breakout above this trendline could offer a buying opportunity.
- Risk Management: Always practice prudent risk management. Use stop-loss orders to protect your capital and avoid over-leveraging in volatile market conditions.
- Stay Informed: Keep abreast of the latest news and developments in the crypto market and the Ethereum ecosystem. Market sentiment and fundamental factors can significantly impact price movements.
Conclusion: Ethereum at a Crossroads
Ethereum currently stands at a crucial juncture. The recent downtrend from $2,625 has been challenged by a recovery attempt. The battle between bulls and bears is intensifying around the $2,580 resistance zone. Whether ETH can overcome the key resistance at $2,625 or succumb to further selling pressure will determine its short-term price trajectory.
Traders should remain vigilant, monitor the key levels, and employ sound risk management strategies to navigate the potential volatility in the Ethereum market. The coming days will likely be decisive in revealing the next major move for ETH.
Related Posts – Ferrari joins the NFT universe through a collaboration with a Swiss…
Disclaimer: The information provided is not trading advice, Bitcoinworld.co.in holds no liability for any investments made based on the information provided on this page. We strongly recommend independent research and/or consultation with a qualified professional before making any investment decisions.