
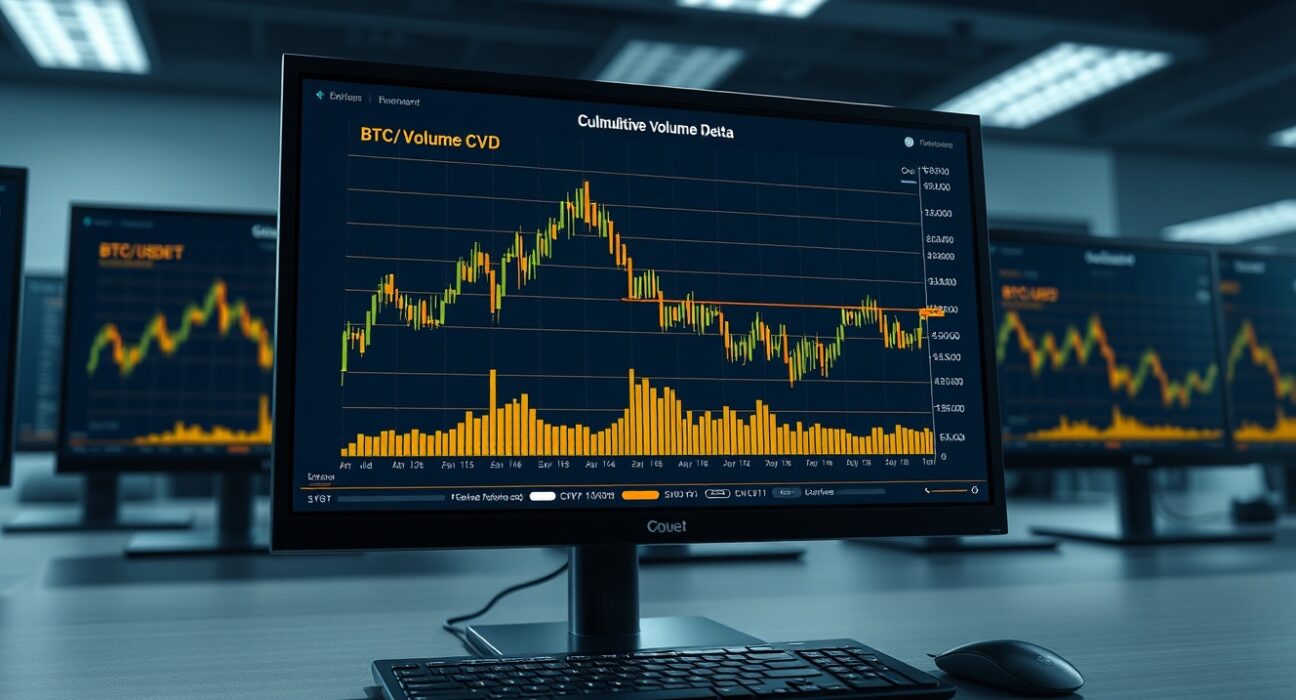
On April 27, 2025, at 12:00 a.m. UTC, traders closely examined the Spot CVD chart for the BTC/USDT trading pair. This analysis provides critical insights into the order book dynamics. The chart combines a volume heatmap with the cumulative volume delta (CVD) indicator. These tools help traders understand buying and selling pressure at specific price levels. This data is essential for making informed decisions in the volatile cryptocurrency market.
Understanding the Spot CVD Chart for BTC/USDT
The Spot CVD chart is a powerful tool for analyzing market microstructure. It tracks the cumulative difference between buying and selling volume. The chart displays two key components. The upper section features a volume heatmap. The lower section tracks the CVD line. The heatmap shows trading activity concentration. Brighter zones indicate higher volume at certain price levels. These zones often act as support or resistance. The CVD line shows net buying or selling pressure. A rising CVD suggests aggressive buying. A falling CVD indicates selling dominance.
Volume Heatmap: Identifying Key Price Zones
The volume heatmap on the BTC/USDT spot chart uses color intensity to represent trading volume. Bright areas show where the price lingered or made significant moves. These zones become critical for future price action. For example, a bright zone near $67,000 might act as strong support. Conversely, a bright zone near $70,000 could become resistance. Traders use these levels to set entry and exit points. The heatmap provides a visual representation of market memory. It shows where other traders have placed orders.
How the Heatmap Informs Trading Decisions
Analyzing the volume heatmap helps traders anticipate price reactions. When the price approaches a bright zone, it may pause or reverse. This happens because many orders cluster at these levels. The heatmap reveals hidden liquidity. It shows where large market participants have placed orders. This information is valuable for both short-term and long-term traders. Short-term traders use it for scalping opportunities. Long-term investors use it to identify accumulation or distribution zones.
CVD Indicator: Tracking Order Flow
The cumulative volume delta (CVD) indicator measures order flow imbalance. It separates buy and sell orders by trade size. The yellow line tracks orders between $100 and $1,000. The brown line tracks large-scale orders between $1 million and $10 million. This distinction is crucial. Retail traders typically place smaller orders. Institutional traders place large orders. By tracking both, the CVD reveals who is driving the market. A rising brown line suggests institutional buying. A falling yellow line might indicate retail selling.
Interpreting CVD Line Movements
When the yellow CVD line rises, it indicates increased buying activity from smaller traders. When the brown line rises, it shows large-scale buying. Divergence between these lines can signal market shifts. For instance, if the brown line rises while the yellow line falls, it suggests institutional accumulation during retail selling. This is often a bullish signal. Conversely, if the brown line falls while the yellow line rises, it may indicate distribution. Traders watch these divergences closely. They provide early warnings of trend changes.
Real-World Context: April 27 Market Conditions
On April 27, 2025, the broader cryptocurrency market showed mixed signals. Bitcoin traded near $68,500, with moderate volatility. The Spot CVD chart for BTC/USDT revealed interesting patterns. The volume heatmap showed a bright zone around $68,000. This suggested strong support at that level. The CVD lines showed a slight divergence. The brown line edged higher, indicating institutional buying. The yellow line remained flat, suggesting retail caution. This pattern often precedes a bullish breakout.
Expert Perspective on CVD Data
Market analysts use CVD data to gauge market sentiment. According to trading experts, a rising CVD during a price consolidation is a positive sign. It shows that buyers are absorbing selling pressure. The April 27 data supports this view. The brown CVD line increased by 2.3% over the previous 24 hours. Meanwhile, the price remained range-bound. This accumulation phase often leads to upward price movement. Traders should monitor these signals for potential entry points.
Comparison with Other Indicators
The Spot CVD chart works best when combined with other tools. Traders often pair it with volume profile and order book depth. The volume heatmap shows where volume occurred. The CVD shows who initiated the trades. Together, they provide a complete picture of market dynamics. For example, a bright heatmap zone with a rising CVD confirms strong support. A bright zone with a falling CVD suggests weak support. This combination increases the reliability of trading signals.
| Indicator | What It Shows | Use Case |
|---|---|---|
| Volume Heatmap | Trading volume concentration | Identify support/resistance |
| CVD (Yellow Line) | Small to mid-size orders ($100–$1,000) | Track retail sentiment |
| CVD (Brown Line) | Large-scale orders ($1M–$10M) | Track institutional activity |
Practical Trading Strategies Using CVD
Traders can develop strategies based on CVD data. One common approach is to buy when the brown CVD line rises during a price dip. This indicates institutional accumulation. Another strategy is to sell when the brown line falls during a price rally. This shows distribution. The yellow line provides confirmation. If both lines rise together, it signals strong buying pressure. If they diverge, caution is warranted. The Spot CVD chart for April 27 showed a bullish divergence. This suggests a potential upward move.
Risk Management Considerations
No indicator is foolproof. The CVD chart should be used as part of a broader strategy. Traders must consider market conditions, news events, and overall trend. The April 27 data is a snapshot. It reflects conditions at a specific time. Markets can change rapidly. Therefore, traders should use stop-loss orders and position sizing. The CVD chart provides valuable information, but it does not predict the future. It only shows current order flow dynamics.
Conclusion
The Spot CVD chart for BTC/USDT on April 27, 2025, at 12:00 a.m. UTC offers a detailed view of order book activity. The volume heatmap highlights key support and resistance zones. The CVD lines reveal buying and selling pressure from different trader groups. The data shows institutional accumulation, which is a bullish signal. Traders can use this information to make informed decisions. However, they should combine it with other analysis tools. Understanding market microstructure is essential for success in cryptocurrency trading.
FAQs
Q1: What does the Spot CVD chart measure?
The Spot CVD chart measures the cumulative difference between buying and selling volume for a specific trading pair. It tracks order flow to show market sentiment.
Q2: How is the volume heatmap on the CVD chart useful?
The volume heatmap shows where trading volume is concentrated. Brighter zones indicate high activity levels, which can act as support or resistance in future price movements.
Q3: What do the yellow and brown CVD lines represent?
The yellow line tracks orders between $100 and $1,000, representing retail traders. The brown line tracks orders between $1 million and $10 million, representing institutional traders.
Q4: Can the CVD chart predict price movements?
No, the CVD chart does not predict prices. It provides real-time data on order flow, which helps traders assess buying and selling pressure. It is one tool among many.
Q5: How often should traders check the Spot CVD chart?
Traders should check the CVD chart regularly, especially during high-volatility periods. The April 27 data is a snapshot; continuous monitoring provides better insights.
Disclaimer: The information provided is not trading advice, Bitcoinworld.co.in holds no liability for any investments made based on the information provided on this page. We strongly recommend independent research and/or consultation with a qualified professional before making any investment decisions.