
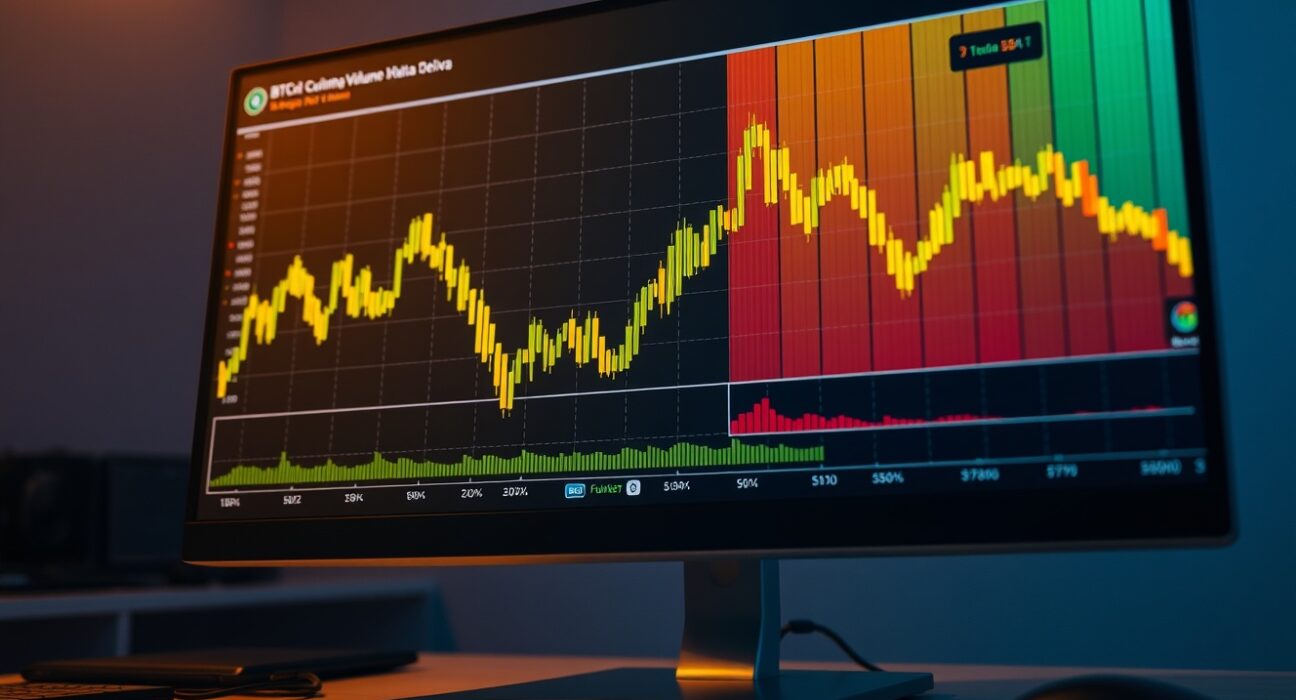
On May 22, 2026, the Bitcoin spot Cumulative Volume Delta (CVD) chart for the BTC/USDT trading pair on major exchanges reveals notable patterns in order book activity. The chart, captured at 12:00 a.m. UTC, provides traders with a detailed view of buy and sell pressure across different trade sizes.
Understanding the Volume Heatmap
The top section of the chart displays a Volume Heatmap, which tracks the concentration of trades at specific price levels. When the price lingers within a certain range or moves sharply through a zone, the background color becomes brighter. These brighter areas often indicate levels where significant trading interest has occurred, and they can act as potential support or resistance zones in the near term.
Interpreting the Cumulative Volume Delta
The lower portion of the chart shows the Cumulative Volume Delta (CVD), which categorizes buy and sell orders by trade size. As buy orders increase, the corresponding colored line rises. For example, the yellow line tracks orders between $100 and $1,000, while the brown line represents large orders between $1 million and $10 million. This breakdown allows traders to see whether smaller retail traders or larger institutional players are driving the current price action.
Why This Matters for Traders
By analyzing the CVD alongside the volume heatmap, traders can gauge the strength of a price move. If a price breakout is accompanied by rising CVD in the large order categories, it suggests genuine buying interest rather than a short-lived spike. Conversely, if price moves on thin volume or small orders, the move may lack conviction.
Conclusion
The BTC spot CVD chart for May 22 provides a snapshot of market microstructure at a specific point in time. While it does not predict future price direction, it offers valuable context for understanding current order flow dynamics. Traders should combine this data with broader market analysis and risk management strategies.
FAQs
Q1: What does the Cumulative Volume Delta (CVD) indicate?
The CVD tracks the difference between buy and sell orders over time, categorized by trade size. A rising CVD suggests net buying pressure, while a falling CVD indicates net selling pressure.
Q2: How is the volume heatmap different from a standard volume indicator?
The volume heatmap shows the concentration of trades at specific price levels, highlighting where the most activity occurred. Standard volume indicators typically show total volume over time, not price-level distribution.
Q3: Can the CVD chart predict Bitcoin price movements?
No single indicator reliably predicts price movements. The CVD chart provides insight into order flow dynamics, which can help traders assess the strength of a trend or identify potential reversal zones when used alongside other tools.
Disclaimer: The information provided is not trading advice, Bitcoinworld.co.in holds no liability for any investments made based on the information provided on this page. We strongly recommend independent research and/or consultation with a qualified professional before making any investment decisions.