

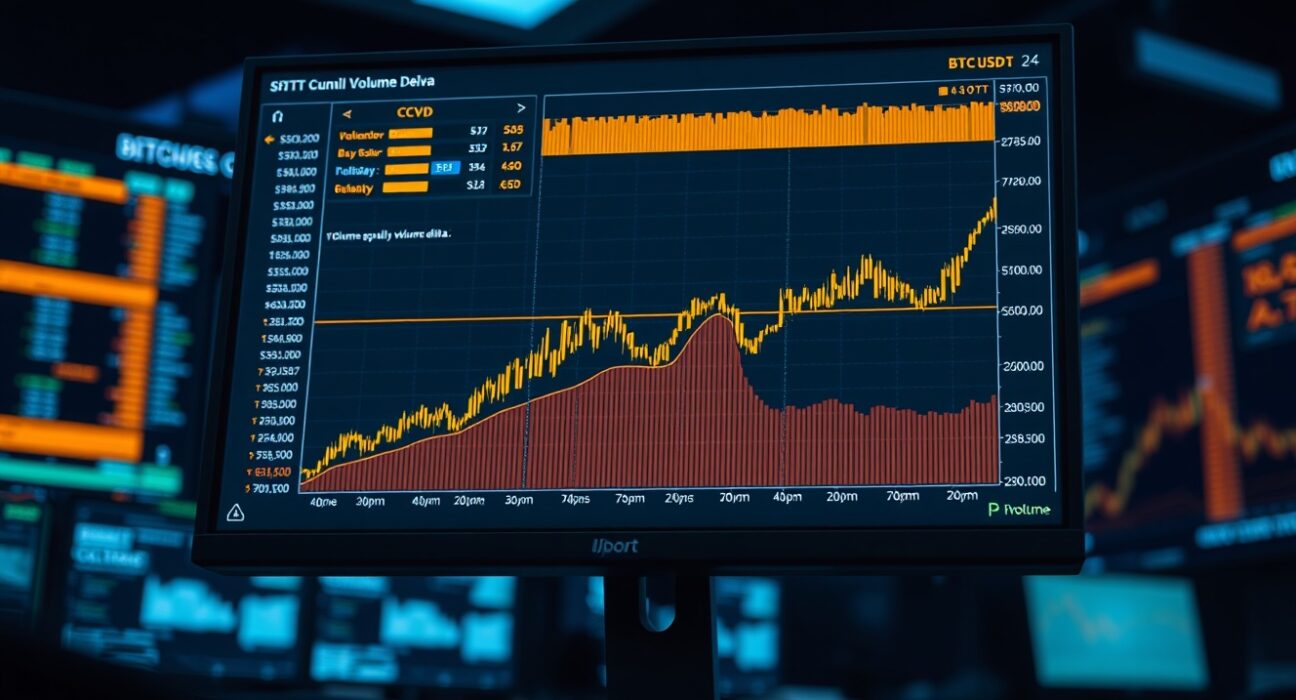
Traders monitoring Bitcoin’s spot market dynamics on May 26 received a detailed look at order flow through the BTC/USDT Cumulative Volume Delta (CVD) chart at 5:00 a.m. UTC. The chart, which analyzes the order book for the spot trading pair, provides a dual-layer view of market activity: a Volume Heatmap at the top and a CVD indicator at the bottom.
Understanding the Volume Heatmap
The upper section of the chart tracks trading volume at specific price levels for BTC/USDT. As the price lingers within a range or makes a significant move, the background color on the heatmap brightens. These brighter areas often serve as visual markers for potential support or resistance zones, offering traders a real-time sense of where liquidity is concentrated. For the period around 5:00 a.m. UTC on May 26, the heatmap would have highlighted any price levels where trading activity intensified, providing clues about market sentiment at that hour.
Cumulative Volume Delta (CVD) Breakdown
The CVD indicator, displayed in the lower portion of the chart, categorizes buy and sell orders by trade size. As buy orders increase, the corresponding colored line rises. Two specific lines are particularly relevant: the yellow line, which tracks orders between $100 and $1,000, and the brown line, which represents large orders between $1 million and $10 million. This distinction allows traders to differentiate between retail-driven activity and institutional-sized moves. At the time of the snapshot, the direction and slope of these lines would have indicated whether buying or selling pressure was dominant across different order sizes.
Why This Matters for Traders
For active Bitcoin traders, the CVD chart is a tool for gauging real-time order flow rather than relying solely on price action. By analyzing the volume heatmap alongside the CVD, traders can identify whether price movements are supported by genuine volume or driven by thin liquidity. The presence of large brown-line orders, for instance, may signal that institutional participants are taking positions, which can influence short-term price direction. This type of analysis is particularly useful during periods of low volatility or ahead of major market events.
Conclusion
The BTC/USDT spot CVD chart at 5:00 a.m. UTC on May 26 offers a granular snapshot of order book activity, combining a volume heatmap with cumulative delta data. For traders focused on Bitcoin’s spot market, this dual-indicator approach provides actionable insights into liquidity levels and the balance between buying and selling pressure across different trade sizes.
FAQs
Q1: What does the yellow line on the BTC/USDT CVD chart represent?
The yellow line tracks cumulative buy and sell orders with trade sizes between $100 and $1,000. A rising yellow line indicates increasing buy orders in this retail-sized range.
Q2: How does the volume heatmap help identify support and resistance?
The heatmap brightens at price levels where trading volume is concentrated. These brighter areas often act as support (where buying interest emerges) or resistance (where selling pressure increases), helping traders anticipate potential price reactions.
Q3: Why is the brown line (large orders) significant for traders?
The brown line tracks orders between $1 million and $10 million, typically associated with institutional or large-scale traders. Movements in this line can signal significant capital flows that may drive sustained price trends.
Disclaimer: The information provided is not trading advice, Bitcoinworld.co.in holds no liability for any investments made based on the information provided on this page. We strongly recommend independent research and/or consultation with a qualified professional before making any investment decisions.
