

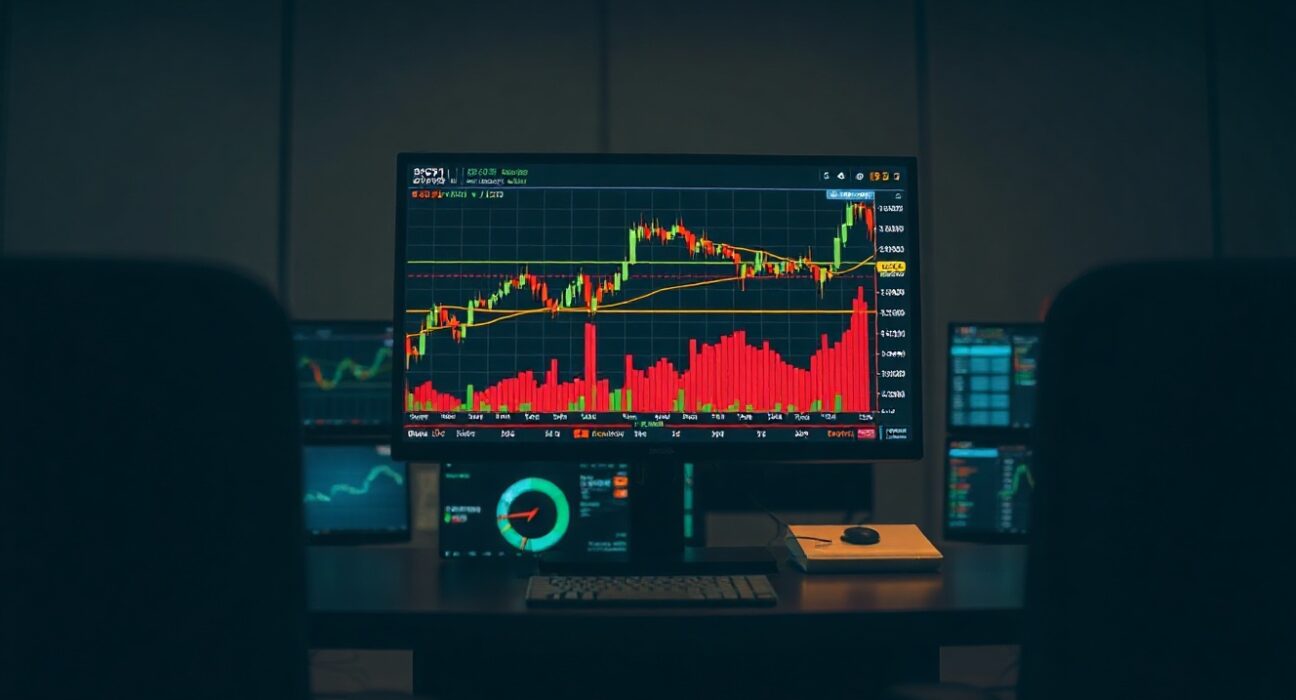
Traders monitoring Bitcoin price action on May 27 observed notable activity in the spot order book for the BTC/USDT pair, as reflected in the Cumulative Volume Delta (CVD) and volume heatmap charts at 10:00 a.m. UTC. These tools provide a granular view of buying and selling pressure at specific price levels, offering insights beyond simple price movement.
Understanding the Volume Heatmap
The top section of the chart displays a volume heatmap, which tracks the concentration of trades at various price levels over time. Brighter areas on the heatmap indicate either prolonged price consolidation or significant directional movement through a particular zone. These high-volume nodes can act as future support or resistance levels, as traders often react to previously established price points.
For the May 27 session, the heatmap revealed distinct clusters of activity, suggesting key price levels where market participants have shown heightened interest. These zones are closely watched by technical analysts for potential breakout or reversal signals.
Cumulative Volume Delta Breakdown
The lower portion of the chart shows the Cumulative Volume Delta (CVD), which separates buy and sell orders by trade size. The CVD line rises as buy orders accumulate and falls when selling pressure dominates. This indicator helps traders gauge the aggressiveness of buyers versus sellers in real time.
Two specific trade-size categories are highlighted: the yellow line tracks orders between $100 and $1,000, representing retail-sized trades, while the brown line tracks large institutional-sized orders between $1 million and $10 million. The divergence or convergence of these lines can signal shifts in market sentiment. For instance, if the brown line rises sharply while the yellow line remains flat, it may indicate that large players are accumulating positions, potentially foreshadowing a price move.
Why This Matters for Traders
Order book analysis, particularly through CVD and volume heatmaps, provides a deeper understanding of market microstructure. Unlike simple price charts, these tools reveal the underlying flow of capital and the balance between supply and demand at a granular level. For active traders, this information can help in identifying entry and exit points, managing risk, and anticipating short-term volatility.
While the CVD chart is a powerful tool, it is most effective when used in conjunction with other technical indicators and broader market context. No single metric provides a complete picture, but the order book dynamics captured at 10:00 a.m. UTC on May 27 offer a valuable snapshot of current Bitcoin market conditions.
Conclusion
The BTC spot CVD chart for May 27 at 10:00 a.m. UTC illustrates the importance of monitoring order book depth and trade-size distribution. By analyzing the volume heatmap and cumulative volume delta, traders can gain actionable insights into market sentiment and potential price levels. As always, these tools should be part of a comprehensive trading strategy that accounts for risk management and broader market trends.
FAQs
Q1: What is the Cumulative Volume Delta (CVD) in Bitcoin trading?
The CVD tracks the net difference between buy and sell orders over time, categorized by trade size. It helps traders understand whether buying or selling pressure is dominant at a given moment.
Q2: How does the volume heatmap identify support and resistance levels?
The heatmap highlights price levels where high trading volume has occurred. These areas often act as support (price floor) or resistance (price ceiling) because traders remember and react to these levels.
Q3: Why are trade sizes between $100 and $1,000 and $1 million to $10 million specifically tracked?
These ranges represent two distinct market participant groups: retail traders (smaller orders) and institutional or large-scale traders (whale orders). Monitoring both provides insight into whether retail or institutional sentiment is driving the market.
Disclaimer: The information provided is not trading advice, Bitcoinworld.co.in holds no liability for any investments made based on the information provided on this page. We strongly recommend independent research and/or consultation with a qualified professional before making any investment decisions.
