
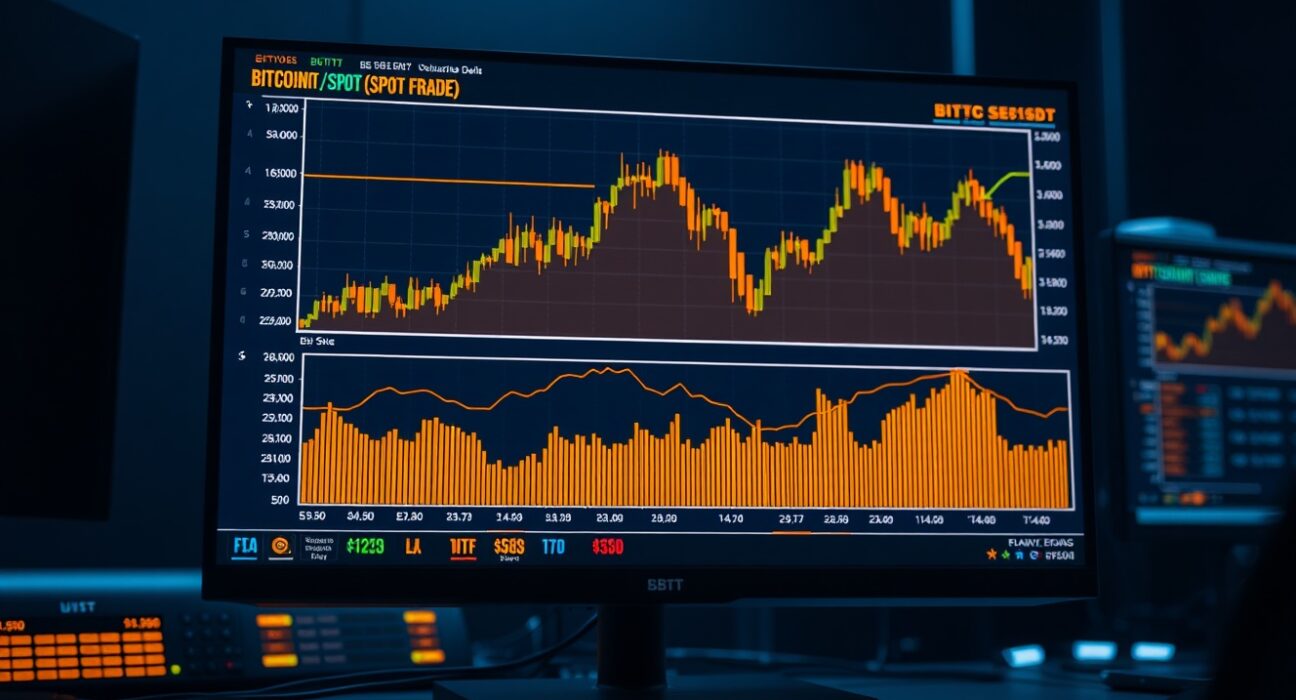
On June 23 at 5:00 a.m. UTC, the BTC/USDT spot market presented a detailed picture of buyer and seller activity through the Cumulative Volume Delta (CVD) indicator and accompanying volume heatmap. These tools, derived directly from order book data, offer traders a granular view of where volume is concentrating and how orders of different sizes are shaping price action.
Understanding the Volume Heatmap
The upper section of the chart displays a volume heatmap, which tracks the intensity of trading activity at specific price levels. When the price lingers in a narrow range for an extended period or experiences sharp movement, the background color becomes brighter. These brighter zones often serve as potential support or resistance levels in future trading sessions, as they represent areas where significant orders were previously executed.
Interpreting the Cumulative Volume Delta (CVD)
The lower section of the chart shows the CVD indicator, which breaks down buy and sell orders by trade size. As buy orders accumulate, the corresponding colored line rises. The yellow line represents smaller retail-sized orders between $100 and $1,000, while the brown line tracks large institutional-sized orders ranging from $1 million to $10 million. Divergences between these lines can signal shifts in market sentiment — for example, if the brown line rises while the yellow line falls, it may indicate that large players are accumulating while retail traders are distributing.
What This Means for Traders
For active traders monitoring BTC/USDT, the CVD chart provides real-time insight into order flow dynamics that standard price charts do not capture. By observing which trade sizes are driving price movements, traders can better assess the strength behind a breakout or a reversal. The combination of the volume heatmap and CVD allows for a more informed evaluation of market structure and potential liquidity zones.
Conclusion
The June 23 BTC/USDT spot CVD chart offers a data-rich snapshot of market activity at a specific point in time. While no single indicator provides complete certainty, the volume heatmap and CVD together offer valuable context for understanding order flow and price level significance. Traders should consider these tools as part of a broader analytical framework.
FAQs
Q1: What does the Cumulative Volume Delta (CVD) indicator show?
The CVD indicator displays the net difference between buying and selling volume, categorized by trade size. It helps traders see whether large or small orders are driving price changes.
Q2: How does the volume heatmap help identify support and resistance?
The heatmap highlights price levels where significant trading volume has occurred. Brighter areas indicate high activity, which often act as zones where price may reverse or consolidate.
Q3: Why are trade sizes important in CVD analysis?
Different trade sizes can reveal the behavior of different market participants. Large orders (brown line) may indicate institutional activity, while smaller orders (yellow line) often represent retail traders. Divergences between them can signal changing market dynamics.
Disclaimer: The information provided is not trading advice, Bitcoinworld.co.in holds no liability for any investments made based on the information provided on this page. We strongly recommend independent research and/or consultation with a qualified professional before making any investment decisions.
