

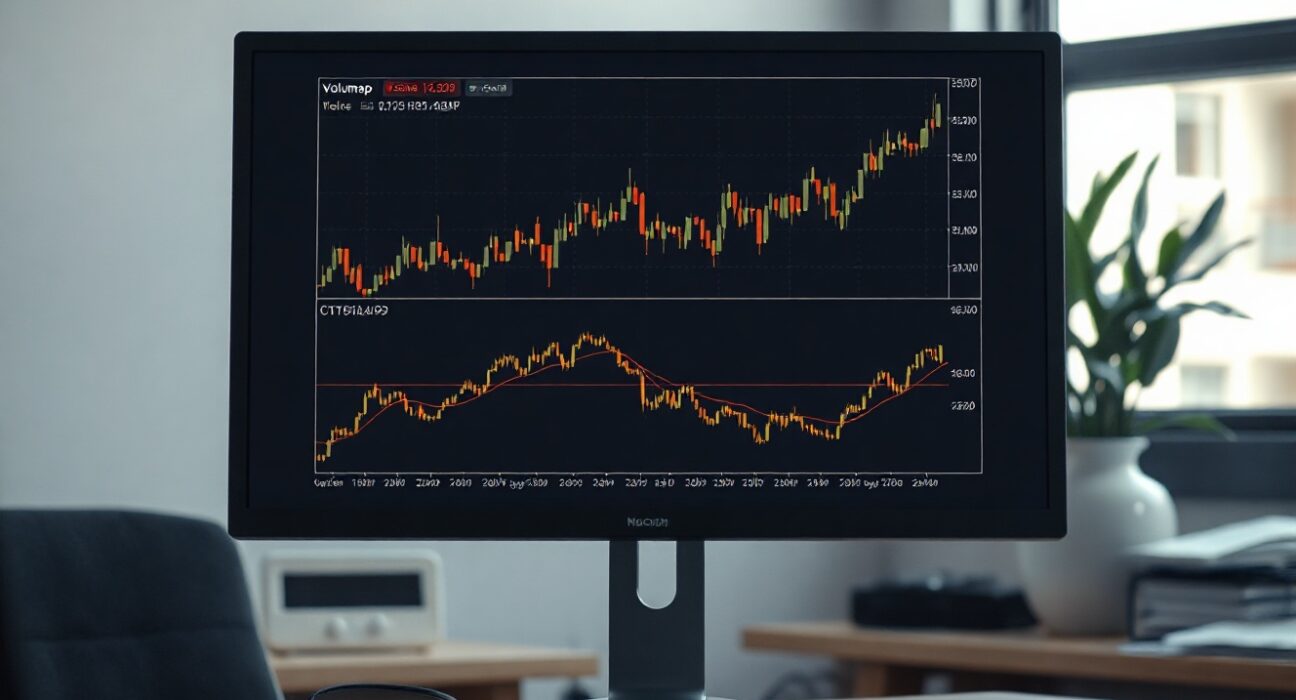
On Aug. 11, traders monitoring the BTC/USDT spot market received a fresh look at order book dynamics through the 9 a.m. spot CVD chart. This chart provides a snapshot of buying and selling pressure by tracking cumulative volume delta (CVD) alongside a volume heatmap, offering a granular view of how capital is moving across price levels.
Understanding the Chart’s Components
The upper panel of the chart displays a volume heatmap, which visualizes trading activity by price range. Brighter areas indicate where the price has lingered or made significant moves, often signaling potential support or resistance zones. The lower panel presents the CVD indicator, which tracks the net difference between buy and sell orders, segmented by order size. Each colored line represents a different capital bracket: for instance, the yellow line tracks orders between $100 and $1,000, while the brown line reflects large orders between $1 million and $10 million. This segmentation helps traders identify whether retail or institutional players are driving momentum.
Why This Data Matters for Traders
For active traders, the spot CVD chart offers a real-time read on order flow that goes beyond price action alone. By analyzing CVD trends, traders can gauge whether buying or selling pressure is building, which can inform entry and exit decisions. The volume heatmap adds another layer, highlighting price levels where significant trading has occurred, which often act as magnets or barriers for future price movement. On Aug. 11, such data could be particularly relevant given ongoing volatility in the crypto market, influenced by macroeconomic factors and shifting investor sentiment.
Interpreting the Signals
When the CVD lines rise, it indicates that buy orders are dominating in that size segment, while declining lines suggest sell pressure. Divergences between the CVD and price can signal potential reversals. For instance, if price makes a new high but CVD fails to follow, it may suggest weakening buying momentum. Conversely, if CVD climbs while price consolidates, it could indicate accumulation. Traders often combine these signals with other technical indicators to confirm trends.
Conclusion
The 9 a.m. spot CVD chart for Aug. 11 provides a detailed look at BTC/USDT order book activity, offering insights into market structure and trader behavior. While no single indicator is foolproof, understanding CVD and volume heatmaps can enhance a trader’s ability to navigate the market. As always, it’s essential to consider broader market context and risk management strategies when making trading decisions.
FAQs
Q1: What is spot CVD?
Spot CVD, or cumulative volume delta, is an indicator that measures the net difference between buying and selling volume in the spot market. It helps traders assess the strength of price moves by showing whether buyers or sellers are more aggressive.
Q2: How is the volume heatmap different from CVD?
The volume heatmap shows the total trading volume at various price levels over a period, highlighting areas of high activity. CVD, on the other hand, tracks the cumulative difference between buy and sell orders, providing a real-time flow of pressure.
Q3: Can the CVD chart predict price movements?
While CVD can reveal underlying buying or selling pressure, it is not a predictive tool on its own. It is most effective when used alongside other technical indicators and market analysis to confirm trends or spot potential reversals.
Disclaimer: The information provided is not trading advice, Bitcoinworld.co.in holds no liability for any investments made based on the information provided on this page. We strongly recommend independent research and/or consultation with a qualified professional before making any investment decisions.
