

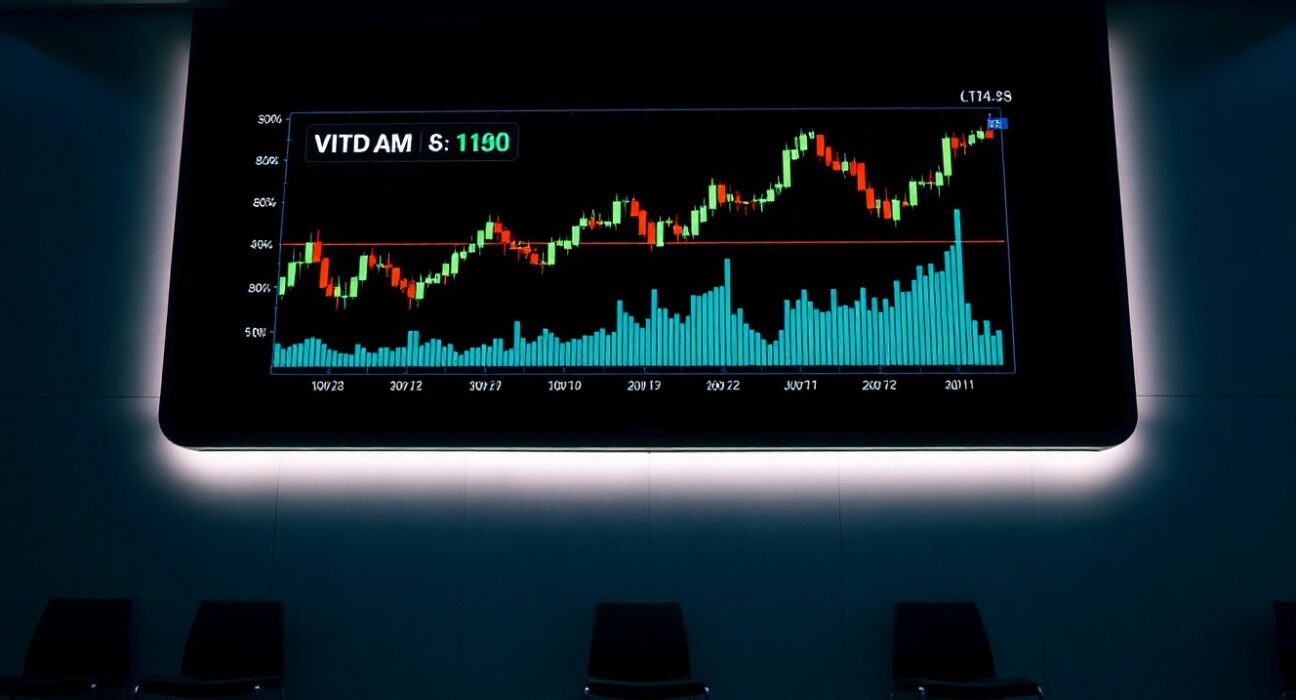
On Aug. 17, the Bitcoin spot cumulative volume delta (CVD) chart for the BTC/USDT pair provided a detailed look into order book dynamics, revealing how trading activity was distributed across price levels and how buy and sell pressure evolved throughout the day. The chart, which combines a volume heatmap with a CVD indicator, is a tool frequently used by traders to gauge short-term market sentiment.
Understanding the Volume Heatmap
The upper section of the chart displays a volume heatmap, which tracks trading volume by price range. The background becomes brighter when the price remains within a specific range for an extended period or when a large move occurs. These brighter zones often act as potential support or resistance levels, as they indicate areas where significant trading activity has taken place. For traders, identifying these zones can help in making informed decisions about entry and exit points.
Interpreting the CVD Indicator
The lower section of the chart shows the cumulative volume delta (CVD), which reflects the net difference between buying and selling volume, broken down by order size. When buy orders dominate, the corresponding line rises. The yellow line represents orders between $100 and $1,000, while the brown line tracks large orders between $1 million and $10 million. This breakdown allows traders to see whether retail-sized orders or institutional-sized orders are driving the market.
Why This Matters for Traders
For active traders, the CVD chart offers a real-time snapshot of order flow. A rising CVD, especially in the larger order size category, may indicate institutional accumulation, while a falling CVD could suggest distribution. The volume heatmap, on the other hand, helps identify price levels where liquidity is concentrated, which can be critical for anticipating price reactions. This type of analysis is particularly useful in a market as volatile as cryptocurrency, where understanding the underlying order flow can provide an edge.
Context and Market Implications
On the day in question, Bitcoin was trading in a range, and the CVD data provided insights into whether buyers or sellers were in control at various price points. The heatmap showed notable activity around key levels, which could serve as reference points for future price movements. While this chart is a snapshot in time, it forms part of a broader technical analysis toolkit that traders use to navigate the market.
Conclusion
The BTC spot CVD chart for Aug. 17 offers a granular view of Bitcoin’s order book, highlighting the importance of volume and order flow in understanding market dynamics. By analyzing the volume heatmap and CVD lines, traders can better interpret the balance between buying and selling pressure, aiding in more informed trading decisions. As always, such tools are most effective when combined with other forms of analysis and a clear understanding of market conditions.
FAQs
Q1: What is the spot CVD indicator?
The spot CVD (cumulative volume delta) indicator measures the net difference between buying and selling volume in a given period, based on the order book. It helps traders see whether buyers or sellers are more aggressive.
Q2: How does the volume heatmap work?
The volume heatmap shows the intensity of trading activity at various price levels. Brighter areas indicate higher volume, which can act as support or resistance zones.
Q3: Why are large orders important in CVD analysis?
Large orders (e.g., $1 million to $10 million) often represent institutional activity. Tracking these can reveal whether big players are accumulating or distributing, which can influence market direction.
Disclaimer: The information provided is not trading advice, Bitcoinworld.co.in holds no liability for any investments made based on the information provided on this page. We strongly recommend independent research and/or consultation with a qualified professional before making any investment decisions.
