

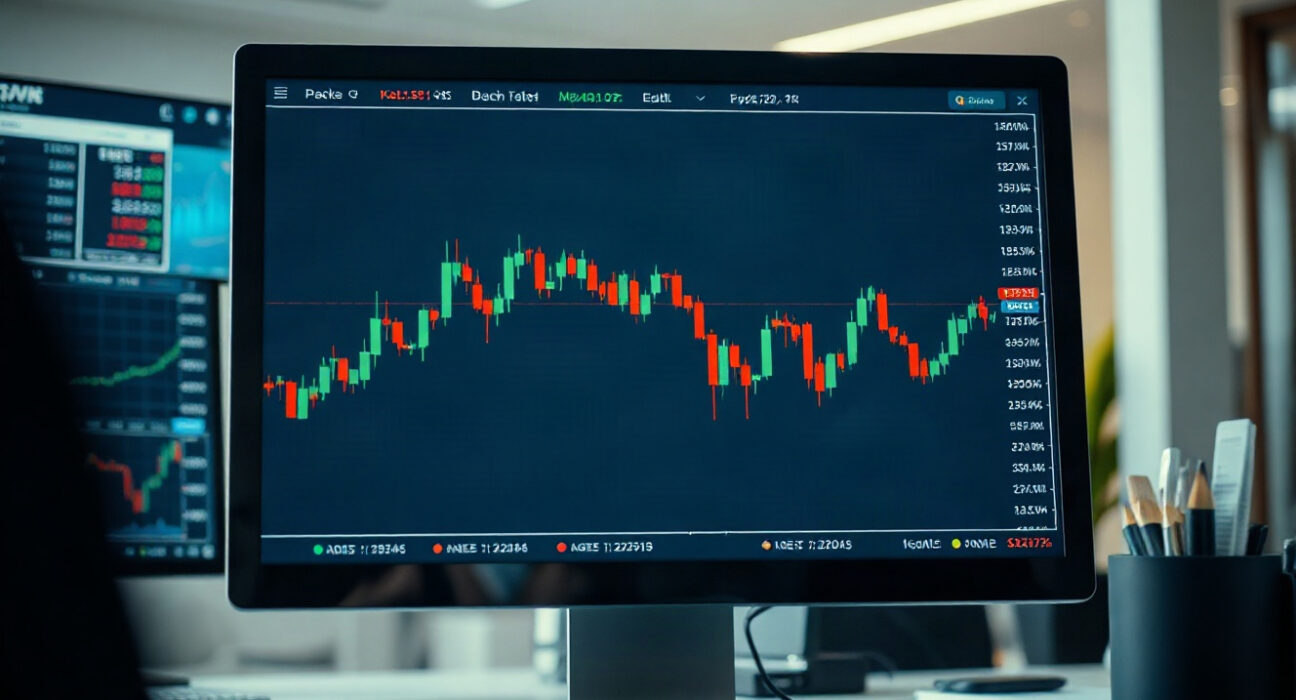
In 2026, mastering key stock chart patterns remains a cornerstone of technical analysis, offering traders a structured way to anticipate market moves. Whether you are a day trader or a long-term investor, understanding these formations can help you identify potential breakouts, reversals, and continuation trends. This guide breaks down seven powerful patterns that are relevant in today’s market environment, with practical tips on how to trade them effectively.
Why Chart Patterns Matter in 2026
Chart patterns are visual representations of market psychology, capturing the tug-of-war between buyers and sellers. In 2026, with increased market volatility and algorithmic trading, these patterns remain useful because they reflect collective behavior that often repeats. Recognizing them early can give traders an edge, but it’s essential to combine them with volume analysis and risk management.
The 7 Chart Patterns to Know
1. Head and Shoulders
The head and shoulders is a reliable reversal pattern that signals a trend change from bullish to bearish. It consists of three peaks, with the middle one (the head) being the highest. The neckline, drawn through the lows, is the critical support level. A break below the neckline confirms the reversal, often leading to a move equal to the distance from the head to the neckline. Traders should wait for a close below the neckline on increased volume to avoid false signals.
2. Double Top and Double Bottom
Double tops and bottoms are reversal patterns that indicate exhaustion of a trend. A double top forms after an uptrend, showing two peaks at roughly the same level, followed by a break below the intervening trough. Conversely, a double bottom occurs after a downtrend, with two lows at similar levels, and a break above the middle peak signals a bullish reversal. These patterns are most reliable when the two peaks or troughs are separated by a noticeable time gap and volume confirms the breakout.
3. Bullish and Bearish Flags
Flags are continuation patterns that represent a brief consolidation after a sharp price move. A bullish flag appears during an uptrend, with a small rectangular channel sloping against the trend, followed by a breakout upward. The bearish flag is the mirror image in a downtrend. These patterns are popular among momentum traders because they offer a relatively low-risk entry point with a clear stop-loss level. The breakout should occur in the direction of the prevailing trend, ideally on higher-than-average volume.
4. Ascending and Descending Triangles
Triangles are consolidation patterns that often lead to continuation of the existing trend. An ascending triangle has a flat upper resistance line and a rising lower support line, indicating that buyers are becoming more aggressive. A breakout above the resistance is a bullish signal. The descending triangle is the opposite, with a flat lower support and a descending upper resistance, typically leading to a bearish breakdown. These patterns are more reliable when they form over several weeks or months.
5. Cup and Handle
The cup and handle is a bullish continuation pattern that resembles a tea cup. The cup forms a rounded bottom, followed by a small downward drift (the handle) that consolidates gains. A breakout above the handle’s resistance confirms the pattern, often leading to a move equal to the depth of the cup. This pattern is particularly useful for identifying long-term accumulation phases and is frequently seen in strong uptrends.
6. Wedges
Wedges are similar to triangles but slope in a specific direction. A rising wedge (with both trendlines sloping upward) is typically bearish, as it indicates weakening bullish momentum. A falling wedge (both lines sloping down) is usually bullish. Wedges can act as reversal or continuation patterns, depending on the preceding trend. For example, a falling wedge after a downtrend often signals a bullish reversal. Traders should watch for a breakout in the expected direction with volume confirmation.
7. Pennants
Pennants are small, symmetrical triangular patterns that form after a sharp price move, representing a brief pause before the trend resumes. They are similar to flags but have converging trendlines. A breakout from a pennant typically occurs in the direction of the prior move, offering a quick trading opportunity. The key is to measure the initial move and project it from the breakout point to estimate the target.
How to Use These Patterns Effectively
While these patterns can be powerful, they are not foolproof. In 2026, market conditions can be influenced by macroeconomic events, earnings reports, and geopolitical news, which can cause false signals. To improve your odds, always wait for a confirmed breakout with volume, use stop-loss orders to manage risk, and consider the broader trend context. Combining multiple patterns and indicators, such as moving averages or RSI, can also increase reliability.
Conclusion
Understanding these seven chart patterns provides a solid foundation for technical analysis in 2026. They help traders identify potential entry and exit points, but success depends on discipline, risk management, and continuous learning. Remember that no pattern works every time, so always use them as part of a comprehensive trading strategy.
FAQs
Q1: Are chart patterns reliable in 2026?
Chart patterns remain useful because they reflect market psychology, but they are not guaranteed. Reliability improves when combined with volume analysis, broader trend context, and risk management.
Q2: What is the best chart pattern for beginners?
For beginners, the double top and double bottom are often easier to identify and trade, as they have clear levels and a straightforward breakout signal.
Q3: How long does it take for a chart pattern to complete?
The time varies widely, from a few days for intraday patterns to several months for long-term formations like the cup and handle. The key is to wait for a confirmed breakout before acting.
Disclaimer: The information provided is not trading advice, Bitcoinworld.co.in holds no liability for any investments made based on the information provided on this page. We strongly recommend independent research and/or consultation with a qualified professional before making any investment decisions.
