

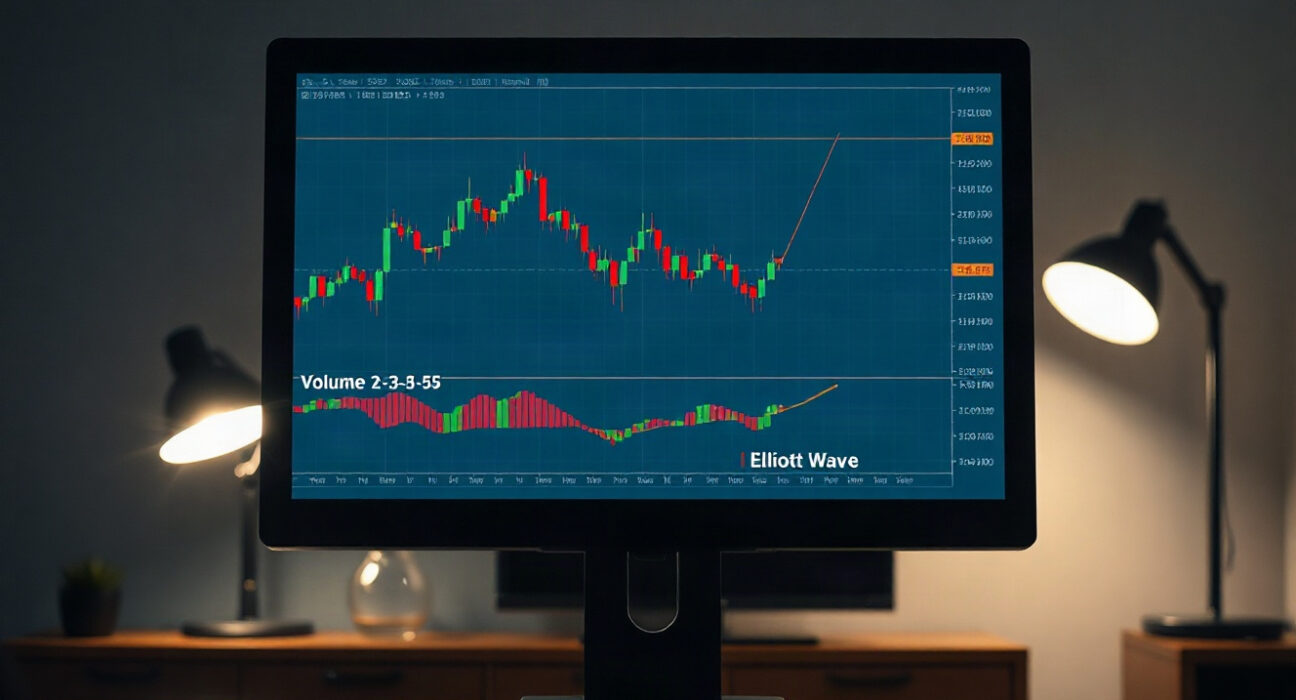
In a recent video analysis, a trader presented a complete oil trade setup using volume profile, liquidity analysis, and Elliott Wave theory, offering a multi-layered approach to navigating crude oil markets. The analysis focuses on identifying key price levels and potential reversal zones, providing a framework that combines market structure with order flow dynamics.
Understanding the Trade Setup
The video breaks down the oil trade by first establishing the broader market context using Elliott Wave principles. This involves mapping the wave structure to determine the likely direction and phase of the market. The trader then overlays volume profile to identify high-volume nodes, which act as support or resistance levels. Liquidity analysis is used to spot areas where stop-loss orders may cluster, offering potential entry and exit points. This combined approach aims to increase the probability of successful trades by aligning multiple technical signals.
Key Technical Indicators
Volume profile is a charting tool that displays trading activity over a specific period at various price levels, unlike traditional volume which is time-based. In the video, the trader highlights the point of control (POC) and value area, which are crucial for understanding where the bulk of trading occurred. Elliott Wave theory, on the other hand, is used to identify recurring price patterns driven by investor psychology. By integrating these tools, the trader demonstrates how to filter out noise and focus on high-probability setups.
Practical Application for Traders
For traders, this analysis offers a structured method to approach oil trading. The video emphasizes the importance of waiting for confluence—when multiple indicators point to the same outcome—before entering a trade. It also underscores the need for risk management, as no analysis is foolproof. The trader suggests that combining volume profile and Elliott Wave can help in setting precise stop-losses and take-profit targets, thereby improving the risk-reward ratio.
Why This Matters
Oil is one of the most actively traded commodities, influenced by geopolitical events, supply-demand dynamics, and macroeconomic data. Technical analysis tools like these are valuable for traders seeking to navigate volatility. This video is particularly useful for those who want to deepen their understanding of advanced charting techniques and apply them to real-world trading scenarios. By learning to interpret volume and wave patterns, traders can make more informed decisions, potentially enhancing their trading performance.
Conclusion
The oil trade analysis presented in the video offers a comprehensive framework for traders, combining volume profile, liquidity, and Elliott Wave theory. While no strategy guarantees success, this multi-faceted approach provides a robust methodology for identifying trading opportunities. As with any trading strategy, it is essential to practice due diligence and risk management. For those interested in refining their technical analysis skills, this video serves as a valuable educational resource.
FAQs
Q1: What is volume profile in trading?
Volume profile is a technical analysis tool that shows trading activity at specific price levels over a given period, helping traders identify key support and resistance zones based on volume.
Q2: How does Elliott Wave theory help in trading oil?
Elliott Wave theory helps traders identify recurring price patterns driven by market psychology, which can assist in predicting future price movements and potential reversal points.
Q3: What is liquidity analysis in trading?
Liquidity analysis involves identifying areas where stop-loss orders and pending orders may be clustered, which can influence price movements as these levels are often targeted by market participants.
Disclaimer: The information provided is not trading advice, Bitcoinworld.co.in holds no liability for any investments made based on the information provided on this page. We strongly recommend independent research and/or consultation with a qualified professional before making any investment decisions.
