

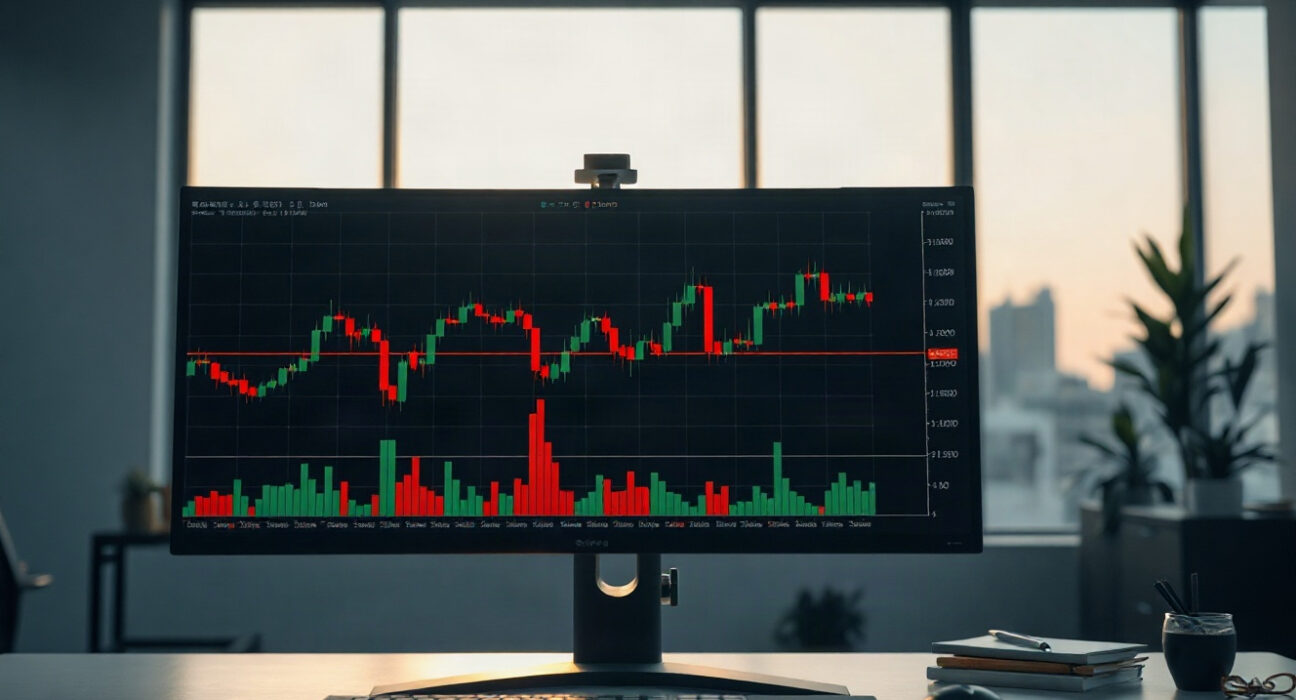
On Sept. 1 at 9:00 a.m. UTC, the BTC/USDT spot order book revealed a notable shift in cumulative volume delta (CVD), a metric that tracks the net difference between aggressive buying and selling. The chart, which pairs a volume heatmap with CVD lines, offers traders a granular view of how order sizes are influencing price action at key levels.
Reading the BTC Spot CVD Chart
The upper section of the chart is a volume heatmap that visualizes trading activity across price levels. Brighter regions indicate where price has lingered or where large moves have occurred, often marking potential support or resistance zones. The lower section displays CVD lines, which accumulate the difference between buy and sell market orders. The yellow line tracks orders between $100 and $1,000, while the brown line represents large orders from $1 million to $10 million. This segmentation helps traders identify whether retail or institutional-sized flow is driving momentum.
At the Sept. 1 open, the CVD lines showed a divergence: the yellow line (smaller orders) was flat, while the brown line (larger orders) edged lower. This suggests that larger market participants were more active sellers during the early UTC session, a signal that could precede short-term downside pressure if sustained.
Why Order-Flow Metrics Matter for Bitcoin Traders
Order-flow analysis, particularly CVD, has gained traction among crypto traders as a complement to traditional volume and price indicators. Unlike simple volume bars, CVD reveals the aggressiveness behind trades—whether buyers or sellers are initiating moves. This can provide earlier signals than lagging indicators like RSI or MACD.
For the BTC/USDT pair, the heatmap highlighted a dense cluster of trading activity near the $58,000–$59,000 range. This zone, which has seen repeated tests in recent weeks, could act as a pivot. A break above with rising CVD would confirm buyer control, while a failure could lead to a retest of lower support near $56,000.
Implications for Market Participants
For short-term traders, the current CVD divergence suggests caution. The lack of buying pressure from smaller orders, combined with selling from large wallets, often precedes a pullback. However, the absence of a sharp price drop indicates that sellers are not yet overwhelming the market. This creates a delicate balance, and traders should watch for a decisive move in either direction with corresponding CVD confirmation.
Long-term investors may interpret the large-order selling as profit-taking rather than a bearish reversal, especially if the broader macro environment remains supportive. The heatmap’s bright areas near $60,000 could attract price back toward that level if buyer interest returns.
Conclusion
The BTC spot CVD chart at the Sept. 1 open provides a nuanced snapshot of market sentiment. While large-order selling hints at institutional profit-taking, the lack of a breakdown suggests resilience. Traders should monitor the $58,000–$59,000 zone closely, as CVD trends will likely determine the next directional move. As always, order-flow data is one tool among many, and combining it with broader market context is essential.
FAQs
Q1: What is spot CVD?
Spot CVD (Cumulative Volume Delta) is an indicator that sums the difference between market buy and sell orders over time. A rising line indicates net buying pressure, while a falling line suggests net selling pressure.
Q2: How does the volume heatmap work?
The heatmap displays trading volume at each price level, with brighter colors indicating higher activity. These areas often become support or resistance because they represent price levels where significant transactions have occurred.
Q3: Why do CVD lines have different colors?
Different colors represent different order sizes. In the chart described, the yellow line tracks orders between $100 and $1,000, while the brown line tracks large orders from $1 million to $10 million. This helps traders see whether retail or institutional traders are driving price moves.
Disclaimer: The information provided is not trading advice, Bitcoinworld.co.in holds no liability for any investments made based on the information provided on this page. We strongly recommend independent research and/or consultation with a qualified professional before making any investment decisions.
