
Buckle up, crypto enthusiasts! The crypto market is experiencing a significant downturn, and Ethereum (ETH), the second-largest cryptocurrency, is feeling the heat. Just when we thought we might see a rebound, negative sentiment has swept across the market, sending ETH prices tumbling. Let’s dive into the technical analysis to understand what’s driving this price action and what we can expect next for Ethereum.
Why is Ethereum Price Plummeting? Decoding the Bearish Signals
Ethereum’s recent price action has flashed some clear bearish signals, indicating that the downward pressure might continue. Here’s a breakdown of the key factors contributing to the current ETH price decline:
- Evening Star Pattern Formation: A bearish evening star pattern has emerged in the Ethereum price chart. This pattern, often seen as a sign of trend reversal, suggests that the previous upward momentum is waning, and sellers are taking control.
- Double Top Pattern and Neckline Breakout: Adding to the bearish outlook, a double top pattern is forming, with the neckline around the $2800 support level. The recent price drop indicates a potential breakout from this neckline, which could accelerate the downward trend.
- Trendline Reversal: Ethereum’s price has struggled to break above a falling trendline, acting as dynamic resistance. This rejection at the trendline further reinforces the bearish sentiment and suggests continued downward pressure.
- Failure to Hold Support: After a brief dip to $2400, ETH prices attempted a recovery but failed to convincingly break through the resistance trendline. This inability to sustain a bullish momentum signals underlying weakness in buying pressure.
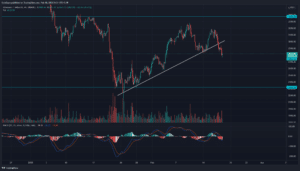
Source : TradingView
Technical Indicators Paint a Bearish Picture
Looking at key technical indicators, the bearish outlook for Ethereum seems to be further validated:
- Moving Averages (EMAs): The Ethereum price is currently trading below both the 20 and 200 Exponential Moving Averages (EMAs). Furthermore, these EMAs are bearishly aligned, with the 20 EMA below the 200 EMA. This configuration is a classic bearish signal, suggesting that the short-term trend is weaker than the long-term trend.
- Relative Strength Index (RSI): The daily RSI currently sits at 44, indicating weakening momentum. Crucially, a bearish divergence is observed in the RSI across the recent price declines. This divergence occurs when the price makes lower lows, but the RSI makes higher lows, suggesting that selling pressure is increasing despite the price drops, and the downward momentum may still have legs.
Short-Term Outlook: Will Ethereum Revisit $2400?
The 4-hour ETH/USD chart provides a closer look at the immediate price action and reinforces the bearish scenario.
Source : TradingView
- Support Trendline Break: Selling pressure has pushed Ethereum prices decisively below a crucial support trendline on the 4-hour chart. This breakdown is a significant bearish development, as trendlines often act as key areas of support or resistance.
- Break Below Support Zone: The latest 4-hour candle has pierced into the support zone with a notable 2.33% drop, further confirming the increased selling momentum and the breakdown of the immediate support area.
Potential Scenarios: What if Bulls Try to Fight Back?
While the technical indicators currently favor the bears, the crypto market is known for its volatility, and unexpected reversals can occur. If bulls manage to regain control, here are the key resistance levels to watch:
- Resistance Levels:
- $3000: This level acts as the immediate resistance. A break above this would signal some bullish resurgence.
- $3400: This is a more significant resistance level, positioned above the resistance trendline. Overcoming this level would require substantial buying pressure and could invalidate the current bearish theory.
MACD Indicator: Confirming the Bearish Momentum
The Moving Average Convergence Divergence (MACD) indicator further supports the bearish narrative:
- Parabolic Fall Below Zero Line: The MACD and signal line have experienced a sharp decline below the zero line. This indicates strong bearish momentum and suggests that selling pressure is dominant.
- Rising Negative Histograms: The negative histograms are showing an increasing trend, which confirms the strengthening selling pressure and the potential for further downward movement.
Key Ethereum Price Levels to Watch
To summarize, here are the critical price levels for Ethereum traders to monitor closely:
| Level Type | Price |
|---|---|
| Resistance 1 | $3000 |
| Resistance 2 | $3400 |
| Support 1 | $2650 |
| Support 2 | $2400 |
Conclusion: Navigating the Ethereum Bear Market
Ethereum is currently facing significant bearish pressure, as indicated by multiple technical indicators and chart patterns. The potential retest of the $2400 low is a real possibility in the short term. Traders should exercise caution and closely monitor price action around the key support and resistance levels outlined. While bearish signals are dominant now, the crypto market can be unpredictable, and a strong bullish reversal is always within the realm of possibility. Stay informed, manage your risk, and trade wisely in this volatile market!
Disclaimer: This analysis is for informational purposes only and should not be considered financial advice. Cryptocurrency trading involves substantial risk of loss. Always conduct your own research and consult with a financial advisor before making any investment decisions.
Related Posts – Ferrari joins the NFT universe through a collaboration with a Swiss…
Disclaimer: The information provided is not trading advice, Bitcoinworld.co.in holds no liability for any investments made based on the information provided on this page. We strongly recommend independent research and/or consultation with a qualified professional before making any investment decisions.