
Buckle up, crypto enthusiasts! Bitcoin (BTC) has taken another rollercoaster dip, breaking below the critical $40,000 support level after hovering comfortably above $42,000. What does this mean for your portfolio and the future of BTC? Let’s dive into a detailed analysis to understand the current market dynamics and what to expect next.
Bitcoin’s Bearish Turn: Key Price Movements
The recent price action indicates a shift into bearish territory for Bitcoin. Here’s a breakdown of the crucial movements:
- Downward Trend Initiation: Starting from well above $42,000, Bitcoin began its descent, signaling a change in market sentiment.
- Breaching Support: The price decisively fell below the $40,000 mark, a level that had previously acted as a strong support.
- Moving Average Breakdown: On the 4-hour chart, BTC closed below the 55 simple moving average, further confirming the bearish momentum.
- Sharp Drop to $36,350: Bitcoin plunged as low as $36,350, smashing through the $38,000 support barrier in a rapid move.
- Partial Recovery: Since hitting the low, BTC has shown some resilience, recovering to trade above $37,000. But is this just a temporary breather?
Decoding Resistance Levels: Where Might Bitcoin Face Hurdles?
As Bitcoin attempts to climb back up, it faces immediate resistance at several key levels. Understanding these resistance points is crucial for traders.
- Immediate Resistance at $38,380: This level is proving to be a significant hurdle. It coincides with the 23.6% Fibonacci retracement level of the recent drop from $44,775 to $36,350.
- Next Major Resistance at $38,500: Closely following the $38,380 mark, $38,500 presents another strong resistance zone.
- Negative Trend Line Formation: A prominent negative trend line is forming on the 4-hour BTC/USD chart, with resistance around $38,350, reinforcing the bearish outlook in the short term.
- $39,000 as a Critical Level: To initiate a meaningful recovery, Bitcoin needs to break above $39,000 decisively.
- Key Resistance Zones Ahead: Looking further up, the 55 simple moving average (4-hours) and the $40,600 level are anticipated to act as significant resistance zones.
The $40,600 Confluence: A Major Turning Point?
The $40,600 level is particularly noteworthy because it aligns with the 50% Fibonacci retracement level of the recent price slide. This confluence of resistance suggests that overcoming $40,600 will be a significant challenge for Bitcoin bulls.
What if Bitcoin Fails to Break Higher?
If Bitcoin can’t muster enough bullish momentum to break through these resistance levels, especially $39,000 and $40,600, we could see further downward pressure. The analysis suggests that:
- Potential for Further Decline: Without an upside break, the price may continue its descent, potentially falling below $37,500.
Support Levels to Watch: Where Could Bitcoin Find a Bottom?
On the downside, several support levels are crucial in determining how far Bitcoin might fall. Monitoring these levels can provide insights into potential buying opportunities or further bearish signals.
- Immediate Support at $37,000: The $37,000 level is the first line of defense. Failure to hold above this could accelerate losses.
- Key Support at $36,350: This level represents the recent low and is a critical support zone. A break below this could trigger a more substantial sell-off.
- Potential Drop to $32,000: If $36,350 fails to hold, the next significant support area is around $32,000.
- Critical $30,000 Support Zone: In a more severe bearish scenario, the $30,000 psychological support level could be tested again. This level has historically been a strong area of interest for buyers.
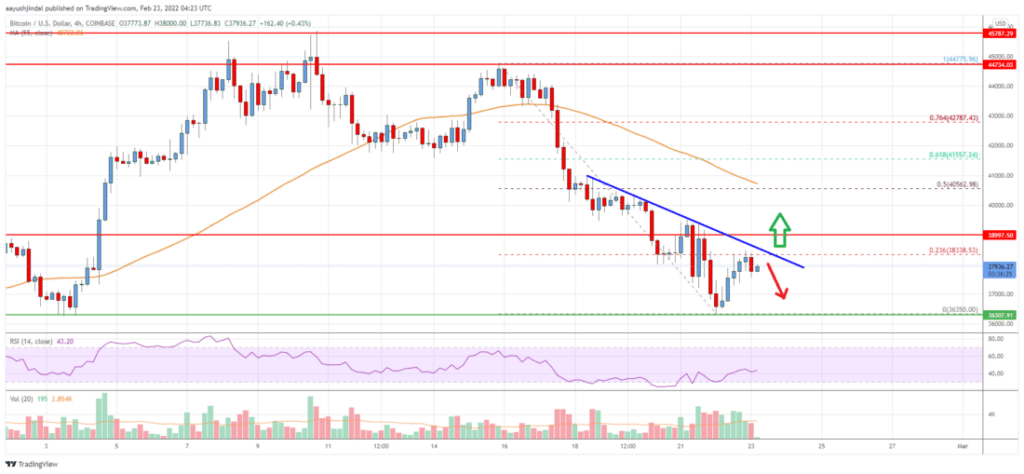
Source : TradingView
Key Takeaways and Actionable Insights for Bitcoin Traders
Here’s a summary of the critical points and what they mean for you as a crypto trader:
- Bearish Momentum: Bitcoin is currently in a bearish trend, trading below $40,000 and the 55 SMA on the 4-hour chart.
- Resistance Hurdles: Significant resistance lies at $38,350, $38,500, $39,000, and $40,600. Breaking above these is crucial for any bullish reversal.
- Support Levels to Watch: Key support levels are at $37,000, $36,350, $32,000, and $30,000. Monitor these for potential bounces or further declines.
- Trading Strategy: In the short term, traders should be cautious and consider resistance levels for potential shorting opportunities and support levels for possible long entries, but always with careful risk management.
- Market Sentiment: Pay close attention to overall market sentiment and news that could influence Bitcoin’s price.
The Road Ahead for Bitcoin: Uncertainty Prevails
Bitcoin’s recent price drop underscores the volatility inherent in the cryptocurrency market. While the technical analysis provides crucial levels to watch, the ultimate direction of BTC will depend on a multitude of factors, including broader market sentiment, macroeconomic conditions, and news flow.
Will Bitcoin manage to break through the resistance and initiate a recovery wave, or are we heading towards further lows? Keeping a close eye on the price action around the key levels mentioned and staying informed about market developments is essential for navigating these uncertain times in the crypto world.
Related Reads: Ferrari joins the NFT universe through a collaboration with a Swiss…
Disclaimer: The information provided is not trading advice, Bitcoinworld.co.in holds no liability for any investments made based on the information provided on this page. We strongly recommend independent research and/or consultation with a qualified professional before making any investment decisions.