On April 10, 2025, at precisely 12:00 a.m. UTC, the Spot CVD chart for the BTC/USDT pair captured a critical snapshot of Bitcoin’s underlying market structure. This detailed order book analysis provides traders with an unprecedented look into real-time buying and selling pressure. Consequently, the chart reveals hidden support and resistance levels that traditional price charts often obscure. Market analysts globally scrutinize this data to gauge institutional sentiment and predict potential price movements. Furthermore, the integration of Volume Heatmap and Cumulative Volume Delta (CVD) offers a dual-layered perspective on market dynamics. This analysis serves as a foundational tool for developing robust trading strategies in the volatile cryptocurrency landscape.
Understanding the Spot CVD Chart Structure
The Spot CVD chart represents a sophisticated analytical framework for the BTC/USDT spot market. Primarily, it bifurcates into two distinct yet interconnected sections. The top section visualizes the Volume Heatmap, a tool that tracks trading activity at specific price levels. Essentially, areas with prolonged price consolidation or significant movement create brighter color zones on the heatmap. These luminous zones frequently transform into formidable support or resistance barriers. Therefore, traders monitor these areas to identify potential reversal or breakout points. The chart’s design emphasizes clarity and immediate visual recognition of high-activity price regions.
Simultaneously, the bottom section illustrates the Cumulative Volume Delta indicator. This metric categorizes and aggregates buy and sell orders based on their monetary size. Specifically, the indicator plots separate lines for different order tiers, providing granular insight into market participant behavior. As buy orders accumulate, the corresponding line ascends, visually representing net buying pressure. Conversely, sustained selling pressure drives the line downward. This real-time delta calculation helps traders distinguish between retail and institutional activity. The chart’s precision allows for nuanced interpretation of market depth and liquidity.
The Mechanics of the Volume Heatmap
The Volume Heatmap functions as a historical footprint of trading intensity. It employs a color gradient, typically from dark to bright, to signify volume concentration. Price levels that witness extended dwell time or high-volume spikes manifest as brighter patches. For instance, a price zone where Bitcoin traded sideways for several hours will appear prominently. These zones often act as magnetic areas for future price action. Market psychology suggests that previous high-volume nodes attract liquidity. Analysts use this data to construct probabilistic frameworks for price behavior. The heatmap effectively translates time and sales data into a actionable visual format.
Key characteristics of an effective Volume Heatmap include:
- Clear visual differentiation between high and low-volume nodes.
- Accurate representation of time-weighted volume.
- Seamless integration with real-time price data.
Deciphering the Cumulative Volume Delta Indicator
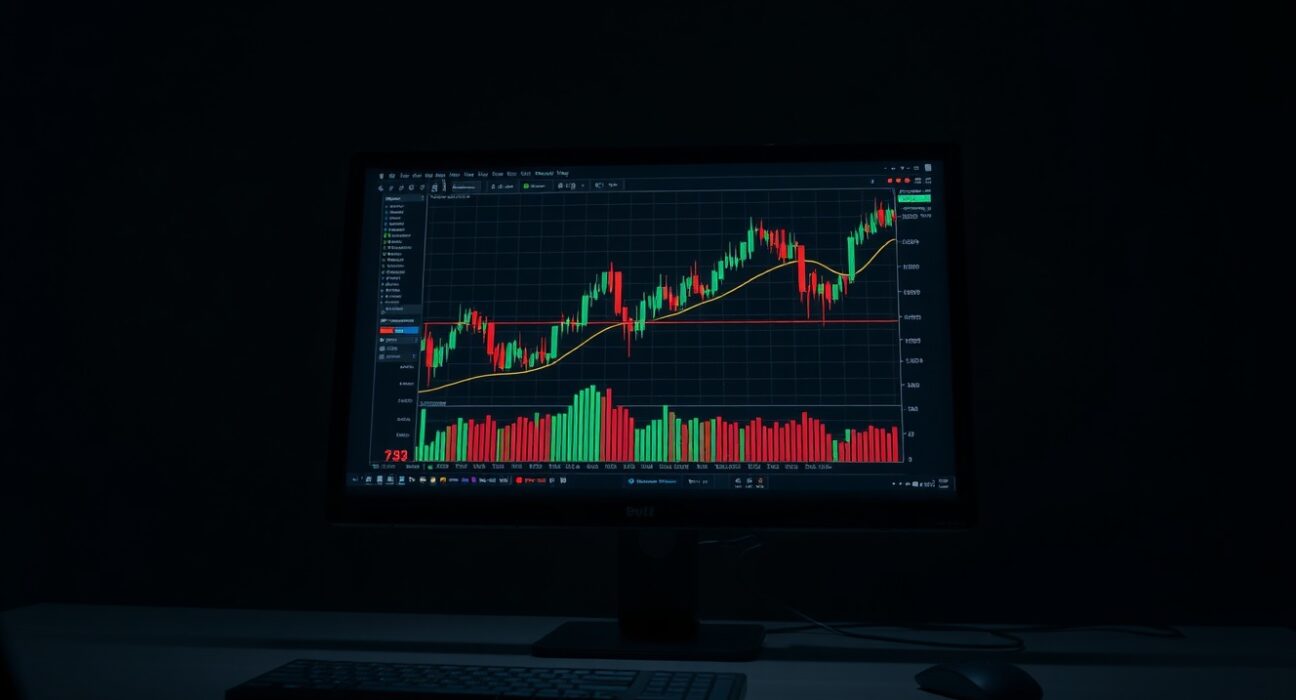
The Cumulative Volume Delta offers a dynamic view of order flow imbalance. It segments the market by categorizing trades into specific size buckets. The chart for April 10 prominently features two colored lines representing distinct order sizes. The yellow line tracks orders valued between $100 and $1,000, typically associated with retail or smaller traders. Meanwhile, the brown line represents large orders ranging from $1 million to $10 million, often linked to institutional players or high-net-worth individuals. Observing the divergence or convergence of these lines provides critical context. For example, if the brown line rises while the yellow line falls, it signals institutional accumulation amidst retail distribution.
This stratification allows analysts to answer pivotal questions about market participation. Is buying pressure driven by whales or retail traders? Are large sell orders being absorbed efficiently? The CVD translates complex order book data into a simple trend line. A steadily rising CVD line indicates sustained net buying, suggesting underlying strength. Conversely, a declining CVD line points to persistent selling pressure, potentially foreshadowing a downturn. The indicator’s cumulative nature smooths out noise, highlighting the dominant order flow trend. Traders combine this data with price action for higher-probability entries and exits.
Interpreting Order Size and Market Impact
The differentiation between order sizes is not arbitrary. Orders between $100 and $1,000 (yellow line) reflect the sentiment of the broader retail cohort. While individually small, their collective action can signify crowd psychology and trend sustainability. In contrast, orders from $1 million to $10 million (brown line) carry significant market impact. A cluster of such large orders can move the market, indicating strategic positioning by sophisticated entities. The interaction between these cohorts often dictates short-term price direction. A market rising on large-order buying (brown line up) is generally considered healthier than one pumped by small, speculative orders. Analysts prioritize congruence between price movement and CVD trends for validation.
The following table contrasts the typical implications of each order size tier:
| Order Size Tier | Typical Participant | Market Impact | Interpretation Signal |
|---|---|---|---|
| $100 – $1,000 (Yellow) | Retail Traders | Low individual impact, high collective impact | Broad market sentiment, trend fuel |
| $1M – $10M (Brown) | Institutions, Whales | High individual impact, moves price | Smart money direction, strategic accumulation/distribution |
Practical Application for April 10, 2025, Market Analysis
The specific chart snapshot for 12:00 a.m. UTC on April 10 provides a case study in applied order flow analysis. First, analysts examine the Volume Heatmap to identify key price levels established in the preceding hours. Bright zones on the heatmap pinpoint where the most trading activity occurred, marking potential support or resistance. Next, they overlay the current price to see if it is approaching or reacting to these levels. Concurrently, the CVD lines reveal the nature of the orders executing at these critical junctures. For instance, a test of a heatmap support level accompanied by a rising brown CVD line suggests institutional buying at support, a strong bullish signal.
This integrated analysis moves beyond simple price prediction. It builds a narrative about *why* the market is moving. Was a breakout supported by large volume? Is a pullback seeing absorption by big buyers? The April 10 chart, when analyzed in the context of the broader 2025 market environment—marked by increasing institutional adoption and regulatory clarity—offers insights into capital allocation trends. Chart patterns devoid of order flow context are incomplete. The Spot CVD chart fills this gap by providing the “who” and “how much” behind the price action. Professional trading desks routinely incorporate this data into their execution algorithms and risk models.
Integrating CVD Data with Macro Trends
Effective analysis does not view the Spot CVD in isolation. In early 2025, Bitcoin markets navigate a landscape shaped by ETF inflows, monetary policy expectations, and technological upgrades like Taproot adoption. The CVD data from April 10 must be contextualized within these macro trends. For example, sustained brown line accumulation could correlate with reported weekly ETF inflows. Conversely, yellow line selling pressure might reflect retail profit-taking after a rally. This synthesis of on-chain flow, macro news, and order book dynamics creates a holistic view. It transforms raw chart data into a strategic asset for portfolio managers and active traders alike.
Conclusion
The Spot CVD chart for BTC/USDT on April 10, 2025, provides a powerful lens into market microstructure. By combining the Volume Heatmap’s identification of key price nodes with the Cumulative Volume Delta’s revelation of order size dynamics, traders gain a significant edge. This analysis underscores the importance of understanding not just where price is, but how it got there and who is involved. As cryptocurrency markets mature, tools like the Spot CVD chart become essential for navigating volatility and identifying high-probability trading opportunities. Ultimately, mastering order flow analysis separates reactive traders from proactive strategists in the digital asset space.
FAQs
Q1: What is the primary purpose of a Spot CVD chart?
The primary purpose is to analyze order book dynamics and order flow imbalance for a specific trading pair, like BTC/USDT. It helps identify support/resistance levels via the Volume Heatmap and reveals whether buying or selling pressure is dominant via the Cumulative Volume Delta.
Q2: How does the Cumulative Volume Delta differ from simple trading volume?
Standard volume shows the total number of assets traded. The CVD shows the *net* difference between buying and selling volume, and it categorizes this by order size. This reveals the direction and source of market pressure, not just the intensity.
Q3: Why is the distinction between small (yellow) and large (brown) orders important?
This distinction helps identify who is driving the market. Large orders often indicate institutional or “smart money” activity, which can have a more sustained impact on price direction. Small orders reflect retail sentiment and can indicate the breadth of a trend.
Q4: Can the Volume Heatmap predict future support and resistance?
It identifies price levels where significant trading activity has previously occurred. These areas often become future support or resistance due to market memory and the concentration of open orders, but they are probabilistic levels, not guarantees.
Q5: How should a trader use this chart in a live trading strategy?
Traders often use it for confluence. For example, they might look for a price bounce off a bright heatmap support level that coincides with a rising CVD brown line (large buy orders). This combination provides a stronger signal than price action alone.
Disclaimer: The information provided is not trading advice, Bitcoinworld.co.in holds no liability for any investments made based on the information provided on this page. We strongly recommend independent research and/or consultation with a qualified professional before making any investment decisions.