

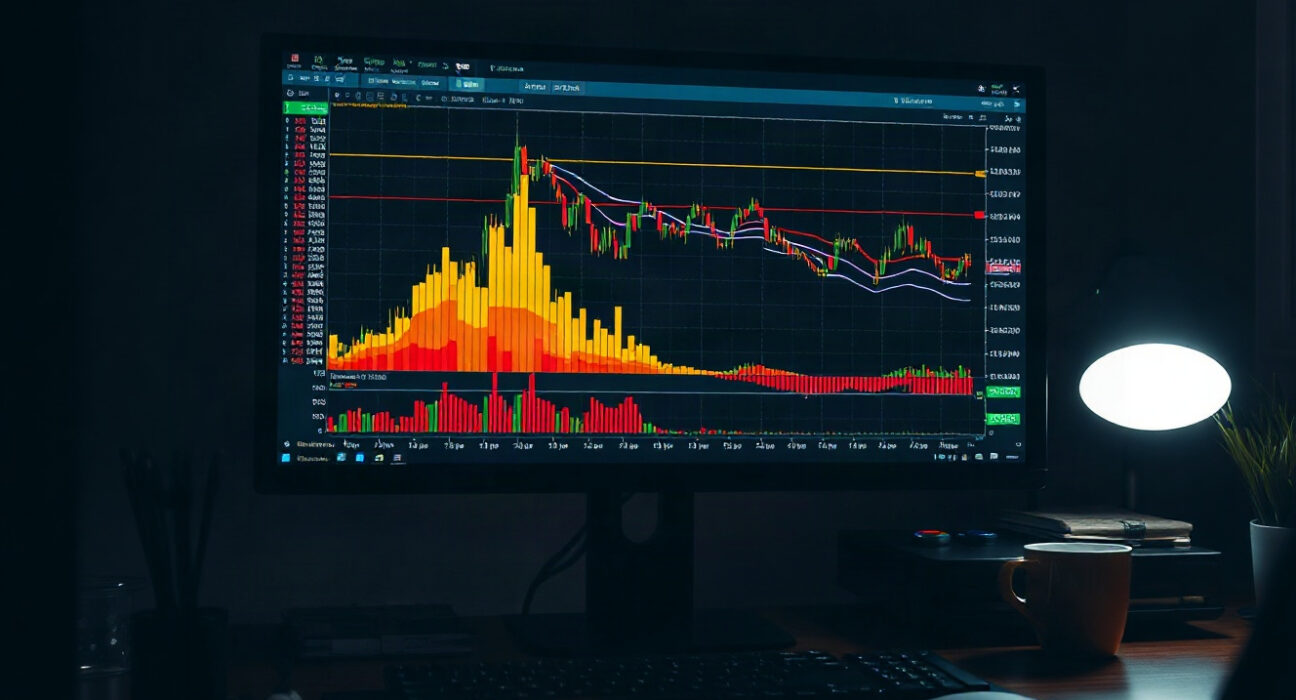
On Aug. 26 at 2 p.m. UTC, the BTC/USDT spot cumulative volume delta (CVD) chart provided a snapshot of order flow dynamics, revealing how buy and sell orders were distributed across price levels. The chart, commonly used by traders to gauge short-term momentum, showed a notable divergence between retail-sized orders and larger institutional trades.
Understanding the Volume Heatmap
The upper section of the chart displays a volume heatmap, which tracks trading activity at each price level. Brighter zones indicate areas where the price lingered or moved sharply, often acting as potential support or resistance. At the time of the snapshot, the most intense activity was concentrated around the $64,000–$65,000 range, suggesting that this zone could be pivotal for future price action.
Traders watch these heatmap clusters because they often reflect where large numbers of orders have been filled, creating liquidity pools that can influence price movement. A breakout above or below these zones may trigger accelerated moves as stop orders are activated.
What the CVD Lines Reveal
The lower section of the chart plots cumulative volume delta, which tracks the net difference between aggressive buying and selling. The yellow line, representing orders between $100 and $1,000, showed a steady upward slope, indicating consistent buying pressure from retail participants. In contrast, the brown line, which tracks large orders between $1 million and $10 million, displayed a flatter trajectory, suggesting that institutional players were less aggressive during this period.
This divergence between retail and institutional behavior can be interpreted as a sign of market indecision. While smaller traders were accumulating, larger players appeared to be waiting for clearer signals, potentially setting the stage for a significant move once the two groups align.
Why This Matters for Traders
Understanding CVD and volume heatmaps helps traders assess the strength behind price movements. A rising CVD alongside a rising price confirms bullish momentum, while a falling CVD on price rallies may signal weakness. In this case, the mixed signals suggest caution, as the market could be building toward a breakout in either direction.
For long-term investors, such order flow data offers insight into market structure, but it is not a standalone predictor. It is most useful when combined with other indicators and broader market context.
Conclusion
The Aug. 26 spot CVD chart highlights a market in a state of equilibrium, with retail buying offset by institutional restraint. Traders should monitor these zones closely, as a decisive move above or below the highlighted levels could set the tone for the next trend. As always, order flow analysis is one piece of a larger puzzle, and prudent risk management remains essential.
FAQs
Q1: What is spot CVD?
Spot CVD, or cumulative volume delta, is an indicator that tracks the net difference between buying and selling volume for a specific trading pair, such as BTC/USDT. It helps traders see whether buyers or sellers are more aggressive over a period.
Q2: How does the volume heatmap work?
The volume heatmap shows the amount of trading activity at each price level, with brighter colors indicating higher volume. These zones can act as support or resistance because they represent areas where many orders have been executed.
Q3: Why is the divergence between retail and large orders important?
Divergence can indicate market indecision. If retail traders are buying while institutional traders hold back, it may suggest that the move lacks strong backing, and a reversal could occur if larger players step in on the opposite side.
Disclaimer: The information provided is not trading advice, Bitcoinworld.co.in holds no liability for any investments made based on the information provided on this page. We strongly recommend independent research and/or consultation with a qualified professional before making any investment decisions.
