

2026-08-31
On August 31 at 9 a.m., the BTC/USDT spot trading pair exhibited notable order-book dynamics, as reflected in the spot Cumulative Volume Delta.
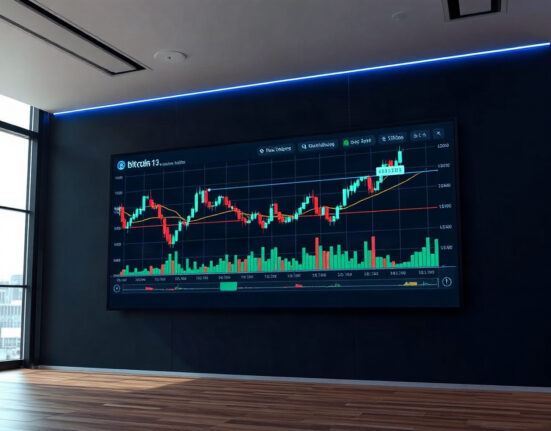
On August 31 at 9 a.m., the BTC/USDT spot trading pair exhibited notable order-book dynamics, as reflected in the spot Cumulative Volume Delta.
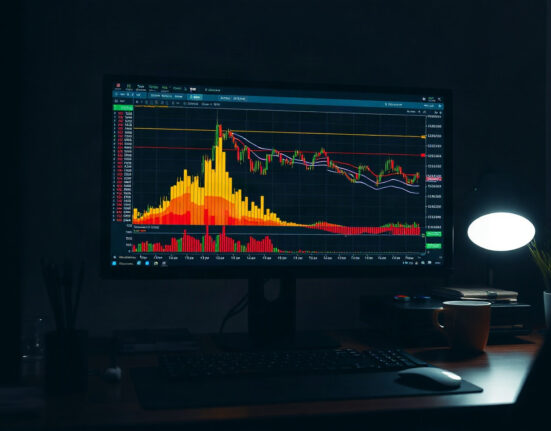
On Aug. 26 at 2 p.m. UTC, the BTC/USDT spot cumulative volume delta (CVD) chart provided a snapshot of order flow dynamics, revealing.
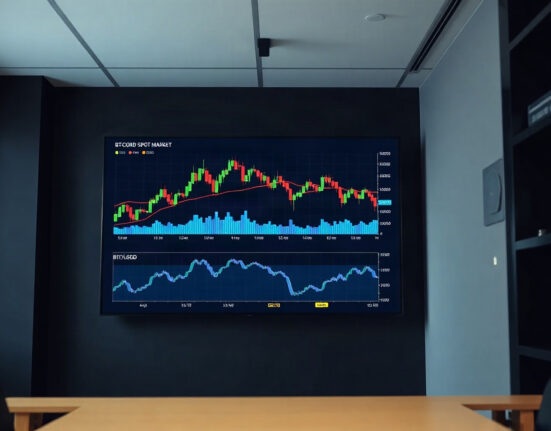
On Aug. 24 at 12:00 a.m. UTC, the BTC/USDT spot trading pair exhibited notable order-book activity, as reflected in the spot cumulative volume.

As of 12:00 a.m. UTC on July 30, the spot cumulative volume delta (CVD) chart for the BTC/USDT trading pair on Binance reveals.
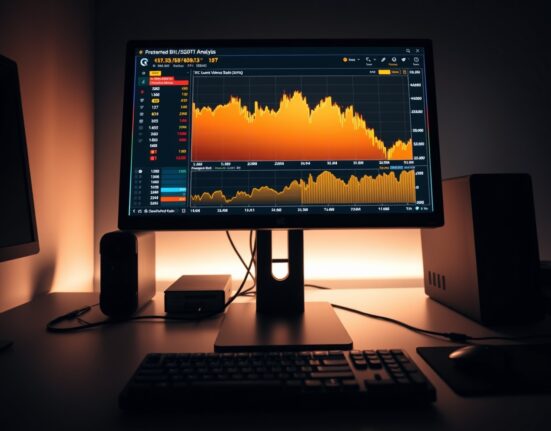
On July 23 at 9:00 a.m. UTC, traders monitoring the BTC/USDT spot market will have access to a specific order-book analysis tool known.
For traders monitoring Bitcoin’s price action on spot markets, the Spot Cumulative Volume Delta (CVD) chart offers a granular view of order flow.

On July 22, the BTC/USDT spot market displayed notable order-book dynamics, as captured by the spot Cumulative Volume Delta (CVD) chart. This analytical.
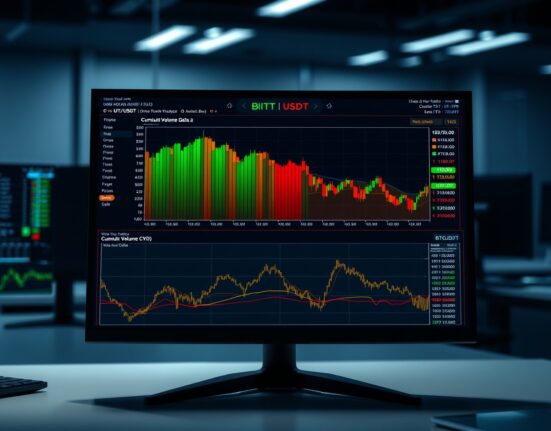
Traders analyzing the BTC/USDT spot market have access to a range of order book tools, one of which is the Spot Cumulative Volume.

For traders analyzing Bitcoin price action on spot markets, the Spot Cumulative Volume Delta (CVD) chart offers a granular view of order flow.

The Spot Cumulative Volume Delta (CVD) chart for the BTC/USDT trading pair provides a detailed view of order book activity as of July.