

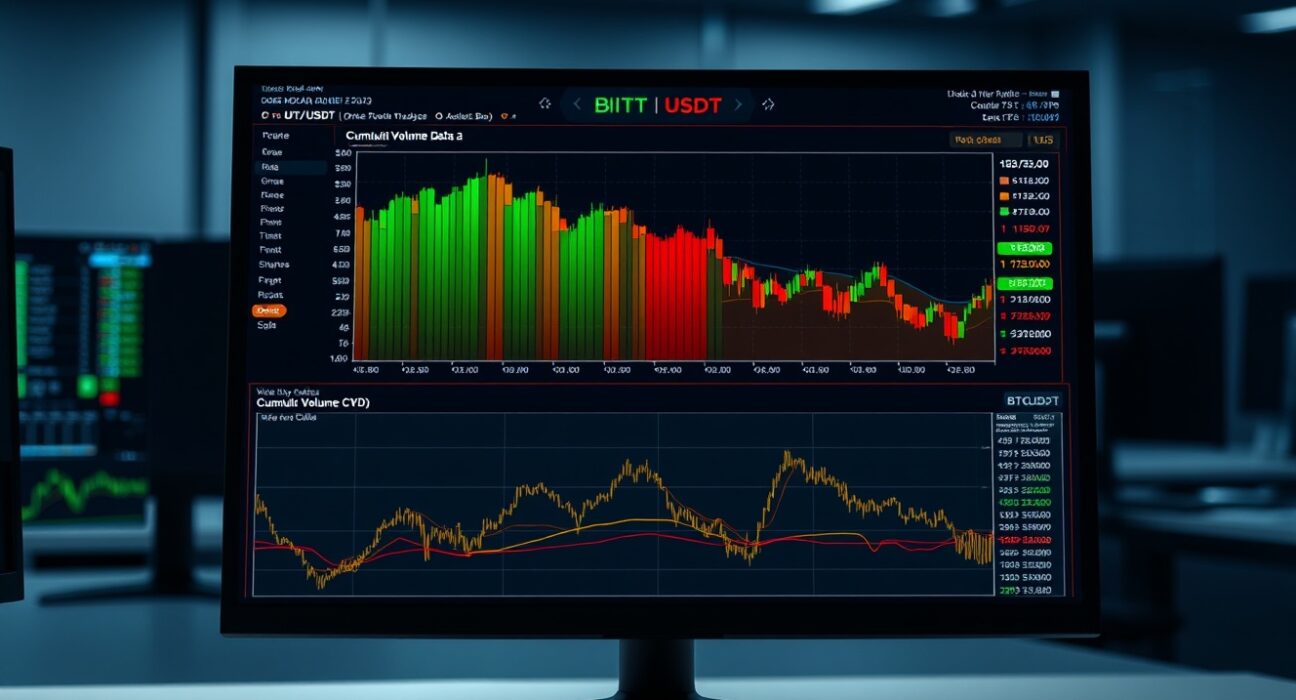
Traders analyzing the BTC/USDT spot market have access to a range of order book tools, one of which is the Spot Cumulative Volume Delta (CVD) chart. This tool provides a visual breakdown of buy and sell activity at specific price levels, helping market participants identify potential support and resistance zones based on actual trade execution data.
Understanding the Volume Heatmap
The upper section of the Spot CVD chart displays a Volume Heatmap. This component tracks the volume of trades executed at each price level over a given period. When the price remains within a certain range for an extended duration, or when a significant price move occurs, the background color in that area brightens. These brighter regions can serve as visual markers for potential support or resistance levels, as they indicate areas where a large number of trades have taken place. Traders often watch these zones for possible price reactions.
Interpreting the Cumulative Volume Delta
The lower section of the chart presents the Cumulative Volume Delta (CVD) indicator. The CVD tracks the net difference between buying and selling pressure by categorizing orders according to trade size. As buy orders increase, the corresponding colored line rises. The chart uses multiple lines to represent different order size categories. For example, the yellow line tracks orders between $100 and $1,000, while the brown line represents large orders ranging from $1 million to $10 million. This segmentation allows traders to observe whether market activity is driven by retail participants or larger institutional players.
Practical Application for Traders
By combining the Volume Heatmap with the CVD, traders can gain a more nuanced view of market dynamics. A bright heatmap zone combined with a rising CVD line in the large-order category may suggest strong institutional support at that price level. Conversely, a bright zone with declining CVD in smaller order sizes could indicate weakening retail interest. This information helps traders make more informed decisions about entry and exit points, though it should not be used in isolation.
Why This Matters for Market Analysis
Order book analysis tools like the Spot CVD chart provide transparency into market microstructure. For active traders, understanding the distribution of buy and sell orders across different price levels and trade sizes can reveal hidden liquidity and potential price inflection points. This type of analysis is particularly relevant in volatile markets where large orders can significantly impact price action. While no single indicator guarantees future price movements, the CVD chart adds a layer of data-driven context to technical analysis.
Conclusion
The Spot CVD chart offers a structured way to visualize BTC/USDT order flow by combining a Volume Heatmap with trade-size-specific Cumulative Volume Delta lines. By highlighting price levels with concentrated trading activity and distinguishing between retail and institutional order sizes, the tool provides traders with actionable insights into market sentiment and potential support or resistance zones. As with all trading tools, it is most effective when used alongside other forms of analysis.
FAQs
Q1: What does the Volume Heatmap show on a Spot CVD chart?
The Volume Heatmap displays the volume of trades executed at specific price levels. Brighter areas indicate higher trading activity or prolonged price stays, which may act as potential support or resistance.
Q2: How does the Cumulative Volume Delta indicator work?
The CVD tracks buy and sell orders categorized by trade size. Each order size range is represented by a different colored line, which rises as buy orders increase, allowing traders to see which participant group is driving activity.
Q3: Can the Spot CVD chart predict price movements?
No single indicator can predict price movements with certainty. The CVD chart provides useful data on order flow and trade concentration, but it should be used in combination with other technical and fundamental analysis tools.
Frequently Asked Questions
What does the Volume Heatmap in the Spot CVD chart show?
It tracks the volume of trades executed at each price level, with brighter colors indicating areas where a large number of trades have occurred, highlighting potential support or resistance zones.
How is the Cumulative Volume Delta (CVD) different from the Volume Heatmap?
The CVD measures the net difference between buying and selling pressure, broken down by trade size categories, while the Heatmap shows total trade volume at specific price levels.
What do the different colored lines in the CVD represent?
Each line represents a different order size category, such as the yellow line for orders between $100 and $1,000 and the brown line for large orders between $1 million and $10 million.
How can a trader use the Spot CVD chart to identify institutional activity?
A bright heatmap zone combined with a rising CVD line in the large-order category suggests strong institutional support at that price level.
What does a bright heatmap zone with declining CVD in smaller order sizes indicate?
It could indicate weakening retail interest or selling pressure at that price level, as smaller orders are decreasing while volume remains high.
Disclaimer: The information provided is not trading advice, Bitcoinworld.co.in holds no liability for any investments made based on the information provided on this page. We strongly recommend independent research and/or consultation with a qualified professional before making any investment decisions.
