

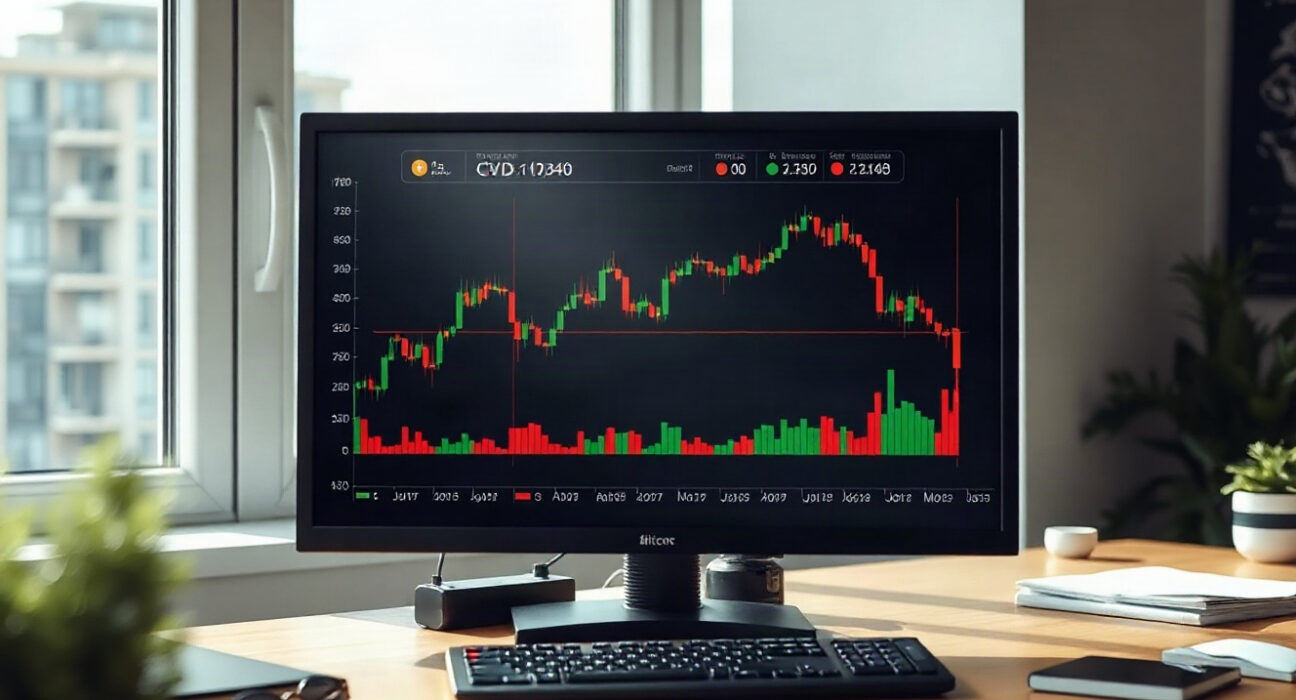
On Aug. 18 at 3:00 p.m. UTC, the BTC/USDT spot market exhibited notable order-flow patterns, as captured by the cumulative volume delta (CVD) chart. This tool, widely used by traders, breaks down buying and selling pressure by order size, offering a granular view of market sentiment beyond price action alone.
Understanding the Spot CVD Chart
The spot CVD chart for BTC/USDT combines two key panels. The upper panel displays a volume heatmap, which visualizes trading activity across various price levels. Brighter zones indicate areas where the price lingered or moved sharply, often acting as potential support or resistance. The lower panel tracks cumulative volume delta, showing the net difference between aggressive buying and selling. Rising lines suggest increased buying pressure, while falling lines indicate selling dominance.
Notably, the yellow line in the CVD panel represents orders between $100 and $1,000, reflecting retail activity. The brown line tracks large orders between $1 million and $10 million, typically associated with institutional or high-net-worth participants. Divergences between these lines can reveal whether smaller traders and larger players are aligned or moving in opposite directions.
What the Data Shows at This Timestamp
At the specified time, the CVD data suggested a mixed but slightly cautious sentiment. The yellow line appeared to be trending upward, indicating sustained retail buying interest. In contrast, the brown line showed a flatter trajectory, suggesting that large orders were not aggressively accumulating. This divergence may imply that while retail traders are optimistic, institutional players are adopting a wait-and-see approach.
The volume heatmap highlighted a concentrated trading zone near recent price levels, which could serve as a short-term pivot area. If price remains above this zone, it may attract further buying; a break below could trigger a shift in momentum.
Implications for Traders and Investors
For traders, the CVD chart provides actionable insights into order flow. The presence of strong retail buying but cautious institutional activity often precedes consolidation. It suggests that the market may be building a base, but without large-order participation, sustained rallies could be limited. Conversely, a sudden uptick in the brown line could signal the start of a more significant move.
For longer-term investors, this data underscores the importance of monitoring not just price, but the composition of market participants. Divergences between retail and institutional flows can offer early warnings of potential reversals or continuations.
Conclusion
The BTC spot CVD chart as of Aug. 18, 3:00 p.m. UTC, reveals a market where retail interest is steady but institutional activity remains subdued. This dynamic often precedes a period of range-bound trading, with the highlighted volume zone acting as a key level to watch. As always, order-flow data is one piece of the puzzle, and traders should combine it with broader market analysis.
FAQs
Q1: What is spot CVD in cryptocurrency trading?
Spot CVD, or cumulative volume delta, is an indicator that measures the net difference between buying and selling volume for a specific trading pair, such as BTC/USDT. It helps traders assess the strength of price movements by showing whether buyers or sellers are more aggressive.
Q2: How does the volume heatmap differ from the CVD line?
The volume heatmap displays the total trading volume at various price levels, highlighting areas of high activity that may act as support or resistance. The CVD line, on the other hand, tracks the cumulative net volume, showing the directional flow of buying versus selling over time.
Q3: Why are order sizes important in CVD analysis?
Order sizes help distinguish between retail and institutional activity. Smaller orders (e.g., $100–$1,000) often reflect retail traders, while larger orders (e.g., $1M–$10M) indicate institutional involvement. Divergences between these groups can provide insights into market sentiment and potential price direction.
Disclaimer: The information provided is not trading advice, Bitcoinworld.co.in holds no liability for any investments made based on the information provided on this page. We strongly recommend independent research and/or consultation with a qualified professional before making any investment decisions.
