
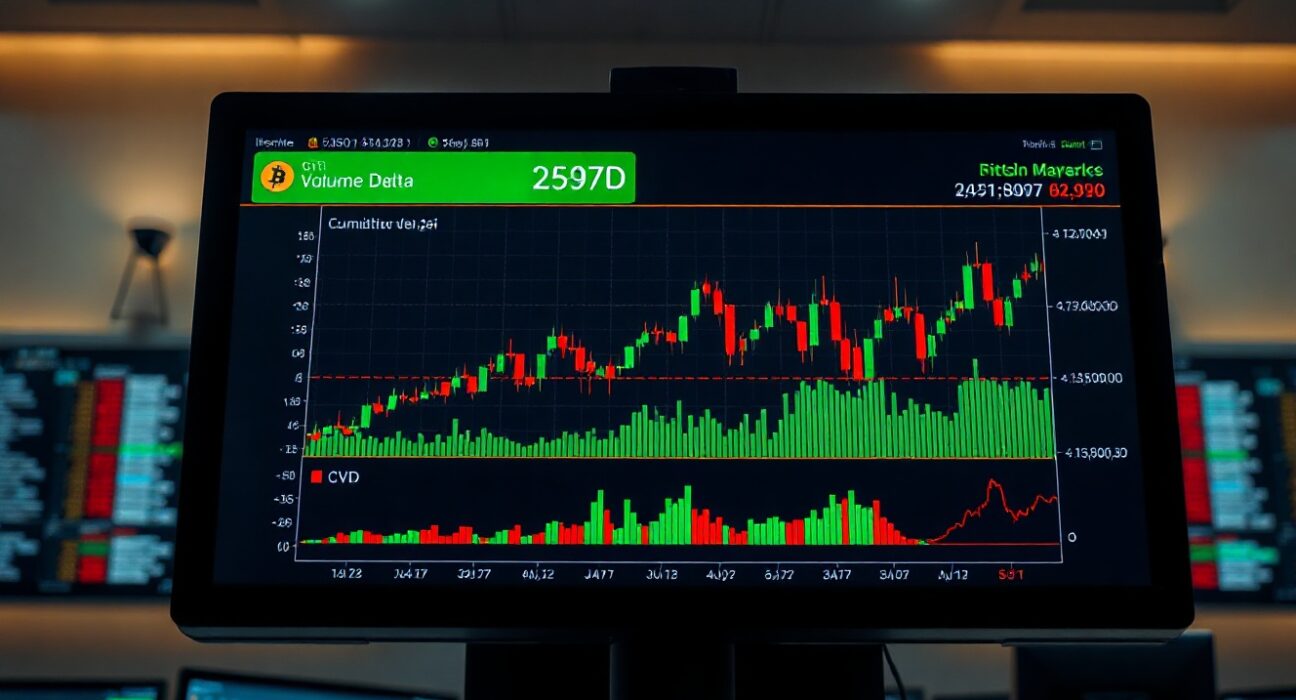
On June 2, the Bitcoin spot Cumulative Volume Delta (CVD) chart for the BTC/USDT trading pair provides a detailed look into order book dynamics, revealing shifts in buying and selling pressure across different trade sizes. The chart combines a volume heatmap with CVD data to help traders identify potential support and resistance zones.
Understanding the Volume Heatmap
The upper section of the chart displays a volume heatmap that tracks trading activity at specific price levels. Brighter areas on the heatmap indicate either prolonged price consolidation or significant price movement at those levels. These zones often act as technical support or resistance, as they represent areas where a high volume of trades has occurred, potentially attracting order book activity in future sessions.
Interpreting the CVD Indicator
The lower portion of the chart shows the Cumulative Volume Delta (CVD), which categorizes buy and sell orders by trade size. As buying pressure increases for a particular size category, its corresponding line rises. For instance, the yellow line tracks orders between $100 and $1,000, while the brown line represents large institutional-sized orders ranging from $1 million to $10 million. Divergences between these lines can signal shifts in market sentiment — for example, if small orders (yellow) are rising while large orders (brown) are falling, it may indicate retail buying against institutional selling.
Why This Matters for Traders
Monitoring CVD alongside the volume heatmap provides a multi-dimensional view of market structure. Traders can use the heatmap to identify key price levels where significant volume has already been executed, while the CVD reveals whether the current order flow is dominated by retail or institutional participants. This combined analysis can help in anticipating potential breakouts or reversals based on real-time order book activity.
Conclusion
The June 2 BTC spot CVD chart offers actionable insights into Bitcoin’s short-term order flow dynamics. By analyzing both the volume heatmap and CVD lines, traders can better assess where support and resistance may form and which market participants are driving price action. As always, CVD analysis should be used in conjunction with other technical indicators and risk management strategies.
FAQs
Q1: What does the Cumulative Volume Delta (CVD) measure?
CVD measures the net difference between buying and selling volume in real-time, categorized by trade size, to show whether aggressive buying or selling is occurring at current price levels.
Q2: How is the volume heatmap different from CVD?
The volume heatmap shows the total amount of trading volume at specific price levels over time, highlighting areas of high activity. CVD focuses specifically on the directional flow of that volume — whether it is predominantly buying or selling.
Q3: Can CVD predict price direction?
CVD is a real-time indicator of order flow imbalance, not a predictive tool. It helps traders understand current market sentiment and can signal potential reversals when divergences appear between CVD lines and price action.
Disclaimer: The information provided is not trading advice, Bitcoinworld.co.in holds no liability for any investments made based on the information provided on this page. We strongly recommend independent research and/or consultation with a qualified professional before making any investment decisions.