
• WTI slips below $82.00 as temporary diplomatic signals emerge
  • Euro Slips Toward 1.1400 as US Launches Fresh Airstrikes on Iran
  • Crypto Mining Guild Addresses the Critical Energy Bottleneck Powering Next-Gen Distributed Networks
  • South Korean Stocks Surpass Bitcoin in Volatility, Bloomberg Reports
  • Altcoin Season Index Drops to 50: Market at a Crossroads Between Bitcoin and Altcoins
2026-07-21
Coins by Cryptorank
Bitcoinworld Bitcoinworld
  • Crypto News
  • AI News
  • Forex News
  • Sponsored
  • Press Release
  • Media Kit
  • Advertisement
  • More
    • About Us
    • Learn
    • Exclusive Article
    • Reviews
    • Events
    • Contact Us
    • Privacy Policy
Bitcoinworld
  • Crypto News
  • AI News
  • Forex News
  • Sponsored
  • Press Release
  • Media Kit
  • Advertisement
  • More
    • About Us
    • Learn
    • Exclusive Article
    • Reviews
    • Events
    • Contact Us
    • Privacy Policy
Skip to content
Home Crypto News BTC Spot CVD Chart Analysis: Volume Heatmap and Cumulative Delta at May 20 Open
Crypto News

BTC Spot CVD Chart Analysis: Volume Heatmap and Cumulative Delta at May 20 Open

  • by Dhaval
  • 2026-05-20
  • 0 Comments
  • 2 minutes read
  • 125 Views
  • 2 months ago
Facebook Twitter Pinterest Whatsapp
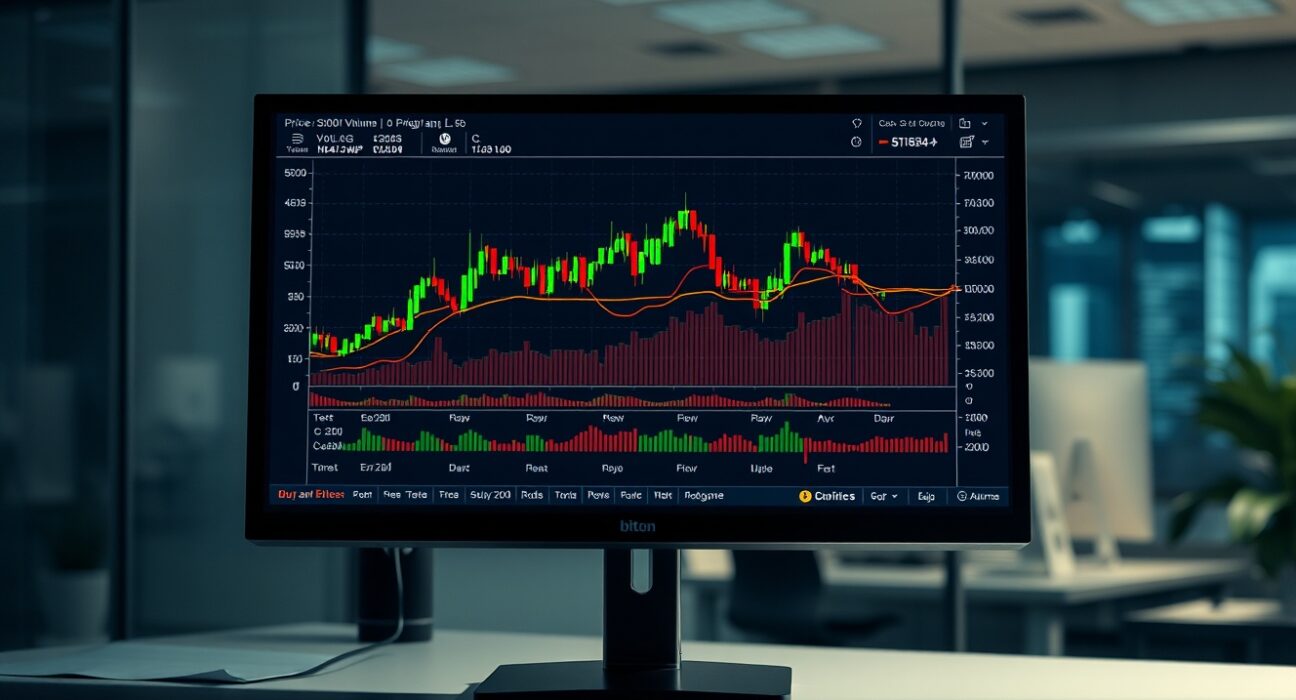
Bitcoin price chart with volume heatmap and cumulative volume delta on a trading monitor

On May 20 at 10:00 a.m. UTC, the BTC spot Cumulative Volume Delta (CVD) chart for the BTC/USDT pair revealed notable patterns in order book activity. The chart, which combines a volume heatmap with a cumulative delta line, offers traders a detailed view of buying and selling pressure at specific price levels.

Understanding the Volume Heatmap

The top section of the chart displays a volume heatmap that tracks the scale of trading volume across different price ranges. When the price remains in a certain zone for an extended period or makes a significant move, the background color intensifies. These brighter areas can act as potential support or resistance levels, providing traders with visual cues about where market participants are most active.

Cumulative Volume Delta Insights

The lower portion of the chart shows the Cumulative Volume Delta (CVD), which categorizes buy and sell orders by trade size. As buy orders increase, the corresponding colored line rises. The yellow line tracks orders between $100 and $1,000, while the brown line represents large orders between $1 million and $10 million. This segmentation helps traders distinguish between retail and institutional activity.

What the Data Suggests

At the time of the snapshot, the CVD lines indicated a steady accumulation of smaller buy orders, while large orders showed intermittent spikes. This pattern may suggest cautious institutional participation alongside consistent retail interest. Traders often watch for divergence between the CVD and price action as a potential signal of trend exhaustion or reversal.

Conclusion

The BTC spot CVD chart at 10:00 a.m. UTC on May 20 provides a granular look at market microstructure. While no single indicator is definitive, the combination of volume heatmap and cumulative delta offers traders a useful framework for assessing supply and demand dynamics in real time.

FAQs

Q1: What is the Cumulative Volume Delta (CVD) in crypto trading?
The CVD tracks the net difference between buying and selling volume at each price level, helping traders identify whether buyers or sellers are in control.

Q2: How does the volume heatmap differ from a standard volume indicator?
The volume heatmap uses color intensity to show where trading activity is concentrated over time, making it easier to spot key support and resistance zones compared to a simple bar chart.

Q3: Why are order sizes between $100 and $1 million tracked separately?
Segregating orders by size helps differentiate retail trading activity from institutional moves, offering insight into who is driving the market at any given moment.

Disclaimer: The information provided is not trading advice, Bitcoinworld.co.in holds no liability for any investments made based on the information provided on this page. We strongly recommend independent research and/or consultation with a qualified professional before making any investment decisions.

Related Reading

  • Altcoin Season Index Drops to 50: Market at a Crossroads Between Bitcoin and Altcoins
  • Decoding the Spot CVD Chart: A Deep Dive into BTC/USDT Order Flow for July 21
  • Crypto Fear and Greed Index Edges Up to 37, Market Sentiment Remains Cautious
  • Bitcoin Reenters Historically Undervalued Zone, On-Chain Data Shows
  • BTC, ETH, XRP and ADA Return to Profit Territory, Raising Short-Term Selling Risk

Tags:

$BTCBITCOINorder bookTrading Analysis

Share This Post:

Facebook Twitter Pinterest Whatsapp
Dhaval

Dhaval

Author
Dhaval Aggarwal covers cryptocurrency markets and Web3 venture investing for BitcoinWorld. His reporting focuses on funding rounds, exchange listings, on-chain treasury activity, and the partnerships connecting crypto-native firms with traditional finance. Since joining the desk in 2023, he has tracked the deal flow behind major Layer-2 networks, Bitcoin treasury programs, and institutional adoption stories. He writes daily news pieces for active traders and longer analyses for readers following where the next cycle of crypto growth is heading.
Previous Post

Indian Rupee Stays Near All-Time Lows as Elevated Crude Oil Prices Add Pressure

Next Post

Gold Price Forecast: XAU/USD Struggles Below $4,500 as US Dollar Strength Persists

Categories

92

AI News

Crypto News

Bitcoin Treasury Ambition: The Blockchain Group Seeks Staggering €10 Billion

Events

97

Forex News

33

Learn

Press Release

Reviews

Google NewsGoogle News TwitterTwitter LinkedinLinkedin coinmarketcapcoinmarketcap BinanceBinance YouTubeYouTubes

Copyright © 2026 BitcoinWorld | Powered by BitcoinWorld