

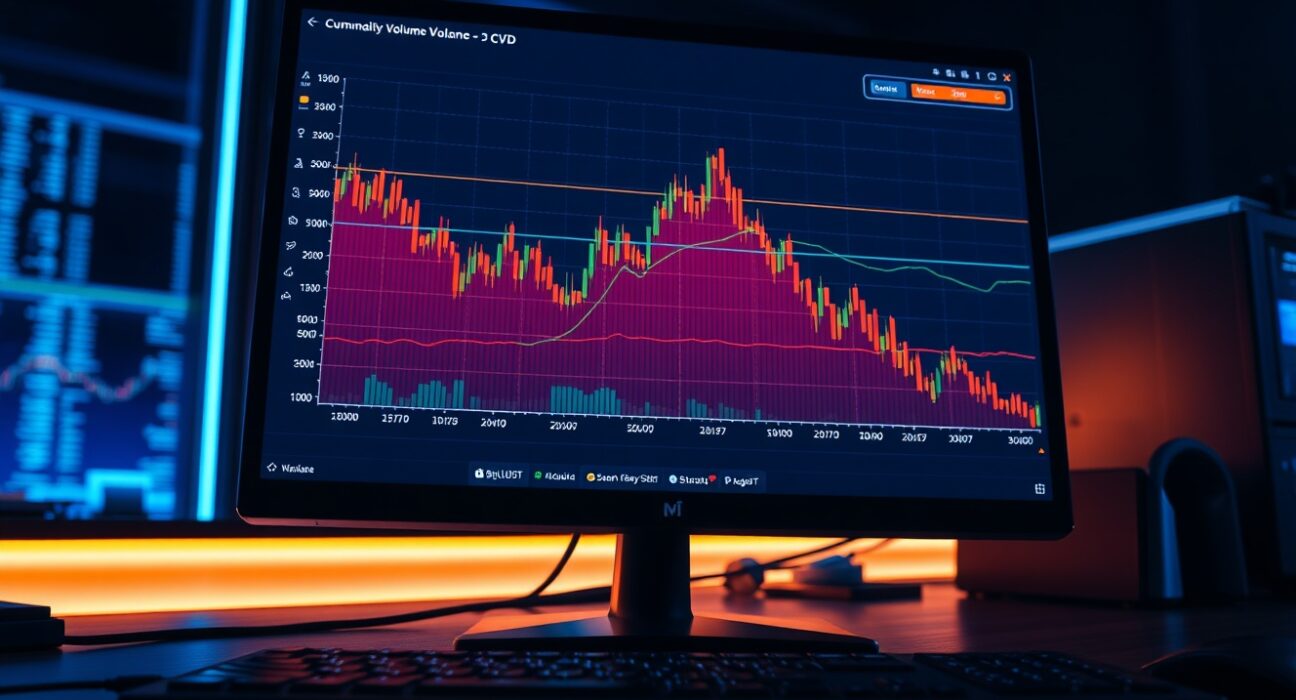
On May 7, the BTC/USDT spot Cumulative Volume Delta (CVD) chart is offering traders a granular look at order flow dynamics, revealing which price levels are attracting significant buying or selling pressure. The CVD indicator, combined with a volume heatmap, provides a real-time snapshot of market microstructure that can help identify potential support and resistance zones.
Understanding the Volume Heatmap
The top section of the chart displays a Volume Heatmap, which visualizes the intensity of trading activity at specific price levels. When the price lingers in a certain range for an extended period or makes a sharp move, the background color brightens. These brighter areas often indicate where large volumes have been transacted, making them potential support or resistance levels that traders monitor closely.
Interpreting the Cumulative Volume Delta (CVD)
The CVD indicator below the heatmap tracks the net difference between buy and sell orders, categorized by trade size. Each colored line represents a specific order size bracket. For example, the yellow line tracks orders between $100 and $1,000, while the brown line tracks large-scale institutional orders between $1 million and $10 million. As buy orders increase, the corresponding line rises, providing a visual cue of aggressive buying or selling pressure.
What This Means for Traders
For active traders, the CVD chart offers a layer of insight beyond simple price action. By observing which order sizes are driving moves, traders can gauge whether retail or institutional participants are dominating the market. A rising CVD line in the large-order bracket, for instance, may signal that whales are accumulating or distributing, which can precede significant price shifts.
Conclusion
The BTC/USDT spot CVD chart for May 7 provides a detailed view of order flow that can help traders identify key price levels and assess market sentiment. While no single indicator guarantees future price movement, combining CVD analysis with volume heatmaps offers a more complete picture of market dynamics. Traders should use this data as part of a broader strategy, remaining aware of the inherent risks in cryptocurrency markets.
FAQs
Q1: What is Cumulative Volume Delta (CVD) in crypto trading?
CVD measures the net difference between market buy and sell orders over a specific period, helping traders identify the strength of buying or selling pressure at various price levels.
Q2: How does a volume heatmap help in chart analysis?
A volume heatmap highlights price levels where significant trading volume has occurred. Brighter areas often indicate potential support or resistance, as these levels have seen substantial order flow.
Q3: Can CVD alone predict Bitcoin price movements?
No, CVD is a tool for analyzing order flow and market sentiment, but it should be used alongside other indicators and analysis methods. It provides useful context but does not guarantee future price action.
Disclaimer: The information provided is not trading advice, Bitcoinworld.co.in holds no liability for any investments made based on the information provided on this page. We strongly recommend independent research and/or consultation with a qualified professional before making any investment decisions.
